 Griperis
Update for Blender 5.1 is now available!
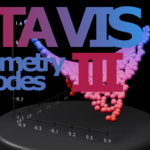
In version 3.0 the data visualization was rewritten using geometry nodes.
This majorly improved performance and flexibility, and allowed to add features
like animated dynamic axis, in-out animations, animated labels and more.
Addon brings 2D and 3D visualisations directly into Blender. You can load CSV data into Blender. Addon provides you with different tools to visualise your data to match your needs. Every chart has customization, that you would expect from any other visualisation tool. And there are animations!
Visit Documentation for overview of all the features!
The addon is free and open-source on GitHub, but if you want to support me you can purchase it here as well.
Changelog:
Version 3.1: Support for Blender 5.0 and 5.1, added button to reload different data on a chart.
Version 3.0: Rewrite of the addon, now charts are created using geometry nodes, making the whole process fully adjustable and procedural.
Version 2.1.1: Added label about no data loaded, don't freeze blender on load
Version 2.1: Data examples, in-addon docs, data inspector, surface chart out of the box, Blender 3.0 support
Version 2.0: Bubble chart with animations, label align function, chart container, data list, reworked UI, extended pie chart settings
Version 1.4: Custom objects for bar and point chart
Get the add-on now for all future updates!
