 Blender Automations


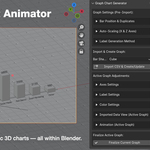
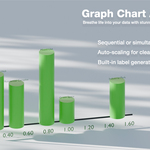

Create Dynamic 3D Bar Charts from CSV Data – In Seconds.
Graph Chart Animator is a powerful Blender addon that transforms your CSV data into stunning, animated 3D bar graphs. Designed for creators, analysts, designers, and architects, it offers a visually rich way to tell stories with data directly within Blender’s 3D environment.
Whether you're showcasing business analytics, architectural reports, or UI/UX prototypes — this tool helps bring your numbers to life.
⚡ Key Features
-
CSV to 3D in One Click: Import CSV files and instantly generate animated 3D bar charts.
-
Flexible Data Types: Supports 2D and 3D data formats (text, value, x-value, etc.).
-
Customizable Bar Shapes: Choose from Cubes, Cones, or Cylinders.
-
Axis & Label Control: Customize axes, label sizes, visibility, and formatting.
-
Color Control: Define bar, label, and axis colors for a visually cohesive output.
-
Intelligent Auto-Scaling: Option to automatically fits your graph within the scene scale.
-
Data Animation: Animate graphs sequentially or simultaneously with adjustable timing.
-
Multiple Graphs in One Scene: Finalize and manage several data visualizations in the same Blender project.
💼 Use Cases
-
Data Visualization for UI/UX Designers
Create sleek animated charts to embed in dashboards or interactive prototypes. -
Architectural Presentations
Use spatial bar placement to represent spatial analytics, timelines, or material consumption. -
Business Reports & Motion Graphics
Blend your business intelligence with cinematic storytelling for pitches, reports, or videos. -
Educational Videos & Infographics
Teach data literacy with interactive and visually engaging 3D charts.
🎬 Animation Ready
Easily animate bar growth and label transitions within Blender’s timeline. Add smooth linear motion with just a few clicks — perfect for motion designers and video editors.
