 multlabs


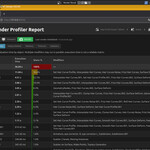
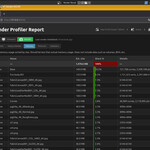
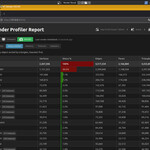
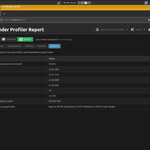
Render Profiler is a Blender add-on that profiles and analyzes render and viewport performance. It opens a live HTML report in your browser with modifier timings, mesh and texture data, memory estimates, statistics and keeps synced with Blender.
This add-on is also available for free at Blender extensions platform: https://extensions.blender.org/add-ons/render-profiler/ But if you want to tip or get additional support, you can get this version.
Where to find it?
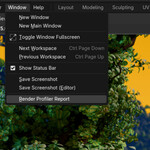
- Topbar → Window → Render Profiler Report
- Or from the File context menu (F4): Render Profiler Report

The report opens in a web browser and refreshes automatically.
Why do I need this?
• "Why is this render so slow?" – The Modifier Times and Heavy Meshes tabs give you data, not guesses.
• "What's eating my GPU memory?" – The Memory and Textures tabs show you exactly which objects and images are the culprits.
• "Is this mesh too dense for rendering?" – Compare vertex counts between viewport and render modes. They're often different.
• "I'm preparing a scene for a client or team – what needs optimization?" – The report gives you an objective, shareable breakdown.
How to get information about rendering?
By default, the profiler shows data from the viewport. If you want to get information from a render:
-
Switch the profiler to render mode by clicking Render on the report page.
-
Press F12 in Blender to start the rendering process. Once the data is initialized, it will be available in the profiler.
Topbar indicator
When profiling is on (Viewport or Render), the top bar shows a short line: Profiling (Viewport) or Profiling (Render) with X button. Use X to turn profiling off or press on indicator to open new report page in the browser.
Modes (mode switcher in the report)
- Off – Profiler disabled. No data collection.
- Viewport – Collects data on viewport updates (e.g. selection, transforms). Data updates as you work.
- Render – Collects data when a render is started (from the render data). Use for renderer analysis.
Performance Notice: Data collection adds some overhead, so slightly worse performance while profiling is expected. If you have issues, consider pressing Off in the report to stop scene profiling and use profiler on demand.
Tabs
- Modifier times — Per-object modifier execution time (ms/s). Objects with modifiers, sorted by total time.
- Heavy meshes — Mesh size: vertices, edges, faces, triangles. Sorted by triangle count. Instance count shown.
- Memory — Unified table of estimated memory: meshes, textures, curves, sorted by estimated size. Volumes are not supported.
- Textures — Texture (image) memory used by at least one object in scene view layer or world: name, materials, size (KB/MB), dimensions.
- Statistics — Combined totals: modifier time, vertices/edges/faces/triangles, object and instance counts, texture memory total, dependency graph debug stats.
Preferences
- Edit → Preferences → Add-ons → Render Profiler
- Report font size – Base font size for the report page. Reopen the report to apply.