 BENNODES

Blender add-on · Scene · v1.5
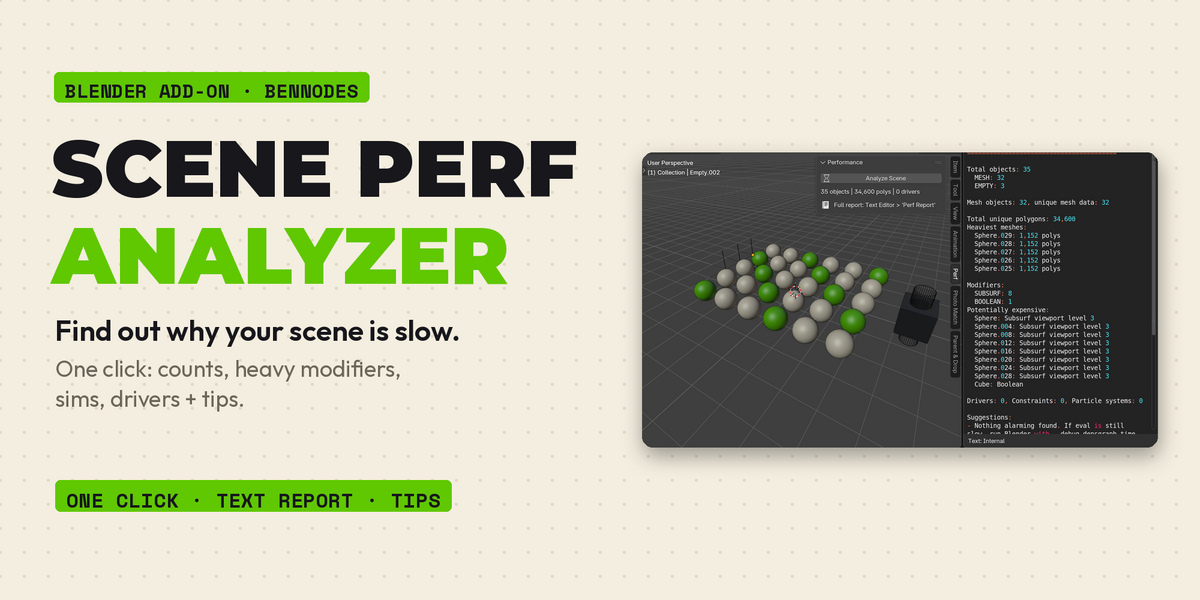
Find out why your scene is slow.
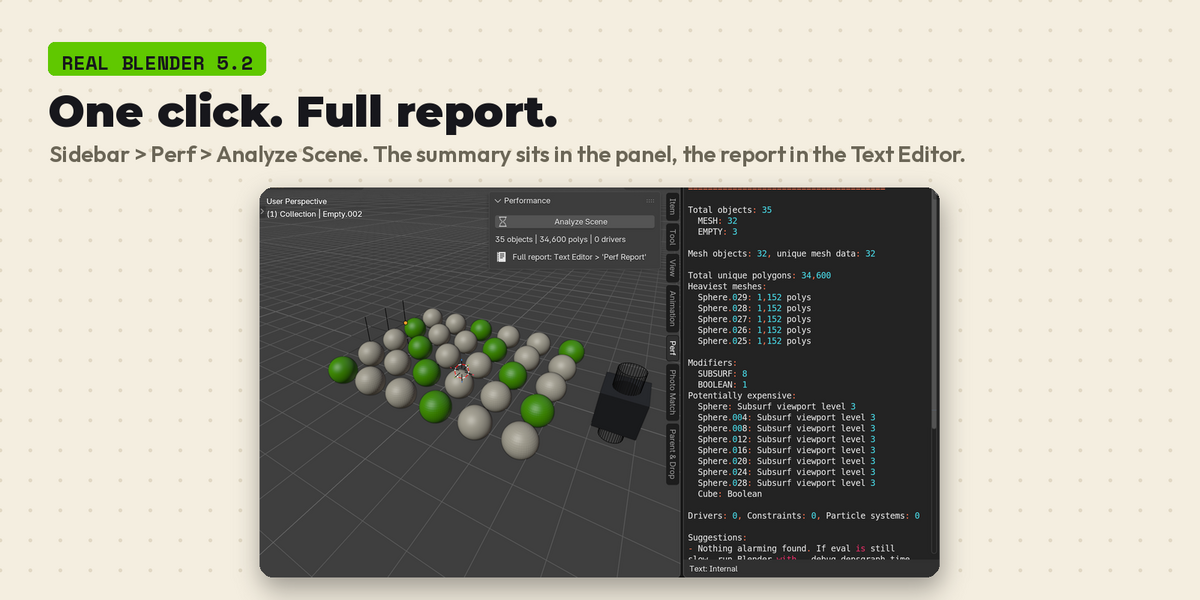
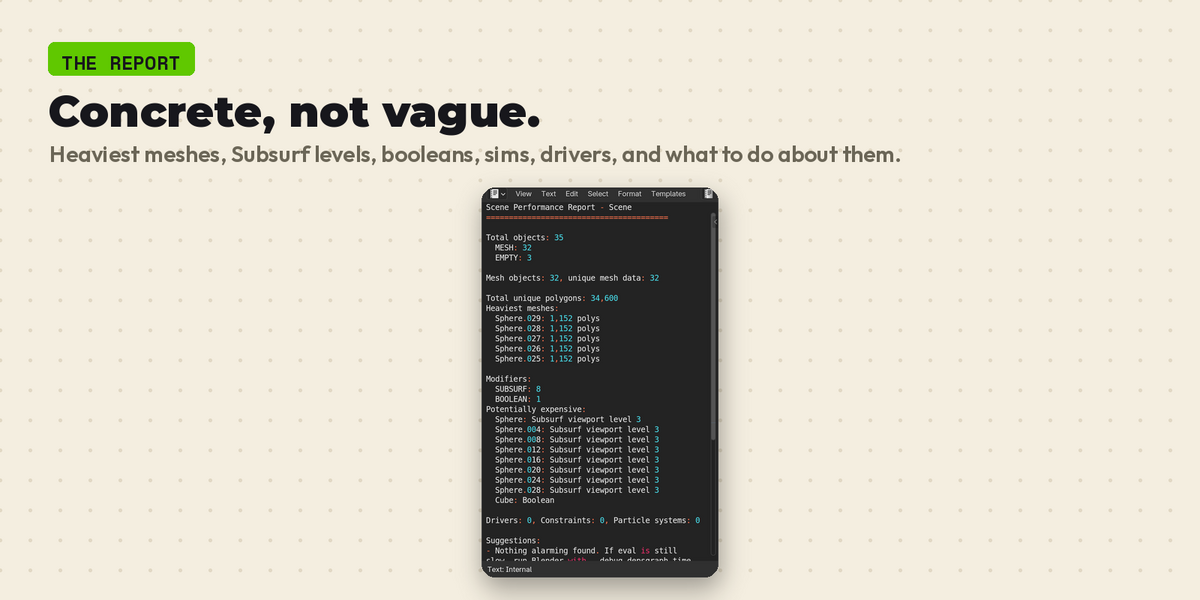
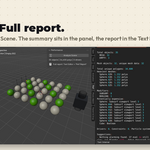
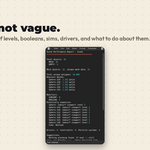
One click and you see what really costs time: the face count after modifiers and instances, the slowest modifiers measured in milliseconds, texture memory, objects that are hidden but still calculated, and a clear fix list. The summary shows in the sidebar, the full report lands in the Text Editor. Optional: an AI fix plan with your own key.
Features
|
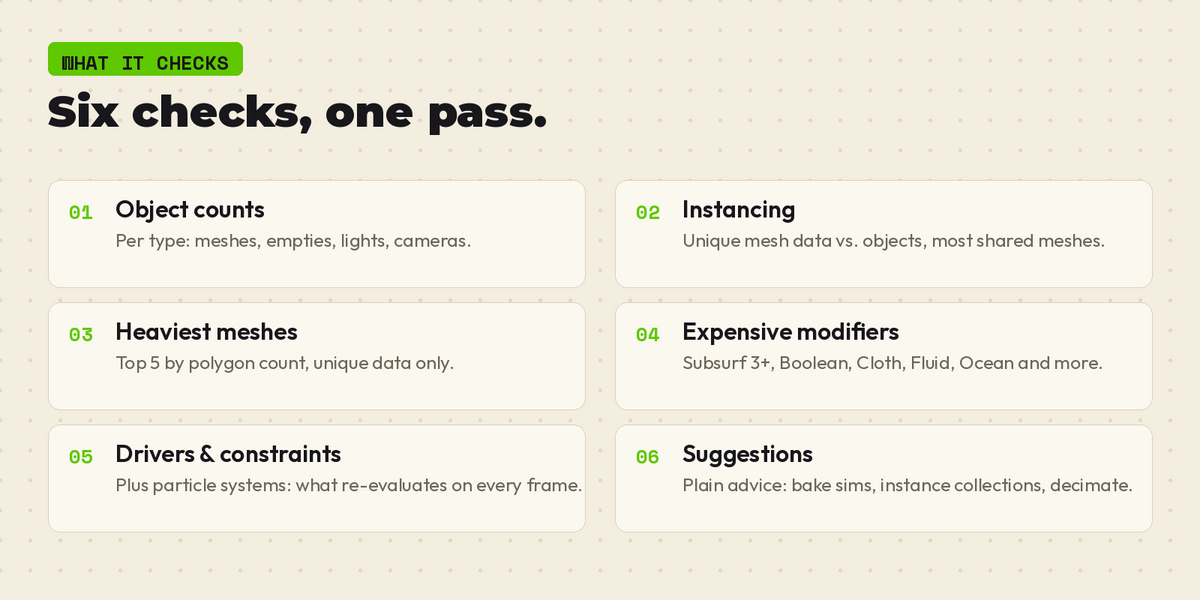
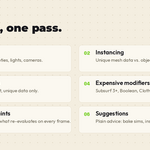
01 Real face count After modifiers, Geometry Nodes and collection instances. |
02 Slowest modifiers Measured in ms per update, top 10. |
03 Texture memory MB per image, 4K+ textures, packed files. |
|
04 Hidden but still calculated Eye-hidden objects and switched-off modifiers that still link. |
05 Render-only cost Unbaked sims, true displacement, Cycles/EEVEE settings, Python drivers. |
06 Fix list + AI plan Concrete steps, most effect first. |
How it works
|
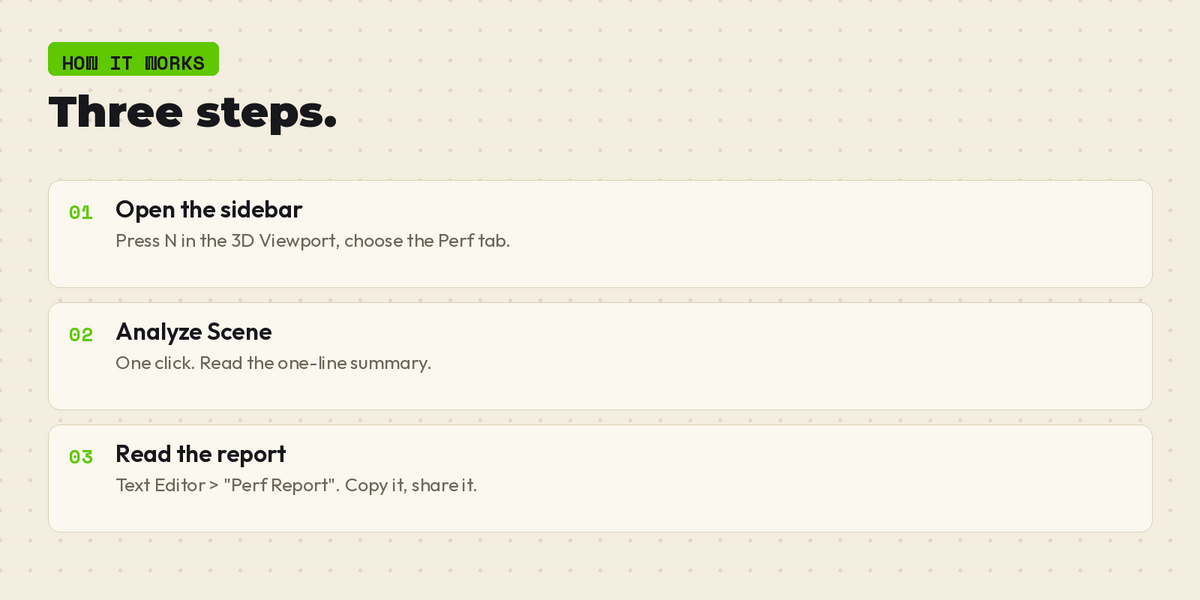
01 Open the sidebar Press N in the 3D Viewport, tab Perf. |
02 Analyze Scene One click. Undo works. |
03 Read the report Sidebar cards + Text Editor "Perf Report". |
Compatibility
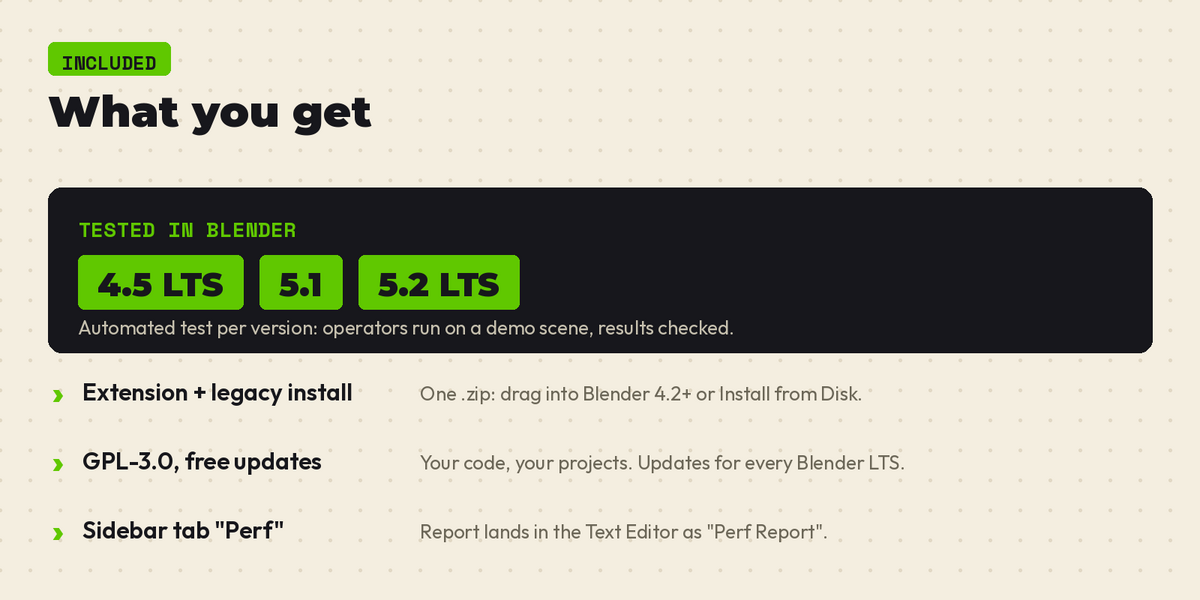
Tested in Blender 4.5 LTS, 5.1 and 5.2 LTS with an automated test per version (operators run on a demo scene, results checked).
Ships as one .zip Blender Extension (Blender 4.5+): drag it into Blender or use Install from Disk. GPL-3.0, free updates. Sidebar tab: Perf. Read-only: it never changes your scene. Themes: Dark, Light or your Blender theme. AI features use your own API key or your own Ollama. Explain with AI sends the full text report (scene, object, material, modifier, node group and image names) to the provider you choose; BENNODES sees nothing.
Made by BENNODES
Small, honest Blender tools by an industrial designer who uses them daily. Questions or ideas: [email protected]