 Hryhory Sinenka


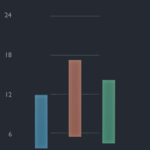
Turn CSV data into editable 3D animation
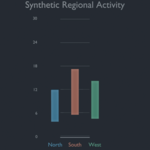
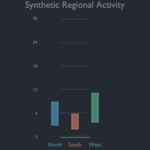
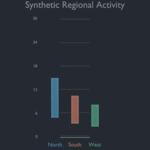
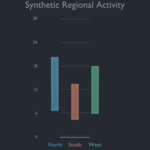
CSV Chart Animator converts a tidy frame,category,value table into an animated 3D bar chart inside Blender. Pick a local CSV file, confirm the column names, choose chart size and interpolation, then build.
The output uses ordinary Blender objects: separate bar meshes, category labels, axis ticks, title, keyframes, and optional camera and lights. Materials, objects, animation curves, camera, and lighting remain editable after the build. Rebuilding replaces only the exact collection name shown in the panel; unrelated scene content is left alone.
Included
Local and predictable
The extension reads the CSV only when you click Build Animated Chart. It contains no network calls, telemetry, account sign-in, cloud service, licence server, external Python modules, or buyer-data collection. The generated scene continues to work without the source CSV.
Supported input
Use one row per frame/category pair. Version 0.1 supports non-negative finite values, up to 50 categories and 500 distinct frames. Every category must have a value at every frame. Duplicate or missing pairs are rejected with an actionable error instead of being silently filled.
Installation
Quick start
Deliberate limits
This release creates vertical bar charts only. It does not import XLSX, clean or analyse data, support negative bars, animate changing text values, or provide custom chart-design services.
Compatibility and QA
Native build/rebuild tests pass in Blender 4.5.12 LTS and Blender 5.2.0 LTS. The final ZIP also passes a clean-profile install-and-enable test in Blender 5.2. EEVEE, Cycles, and Workbench can render the generated standard objects.
Support
Support covers installation, documented tidy-CSV validation, reproducible extension defects, and compatibility with the stated Blender versions. It does not include statistical analysis, spreadsheet repair, chart art direction, bespoke features, or recovery of unrelated scene content. Use the Superhive Inbox for support.
