 Mrs Eliza
1. Overview
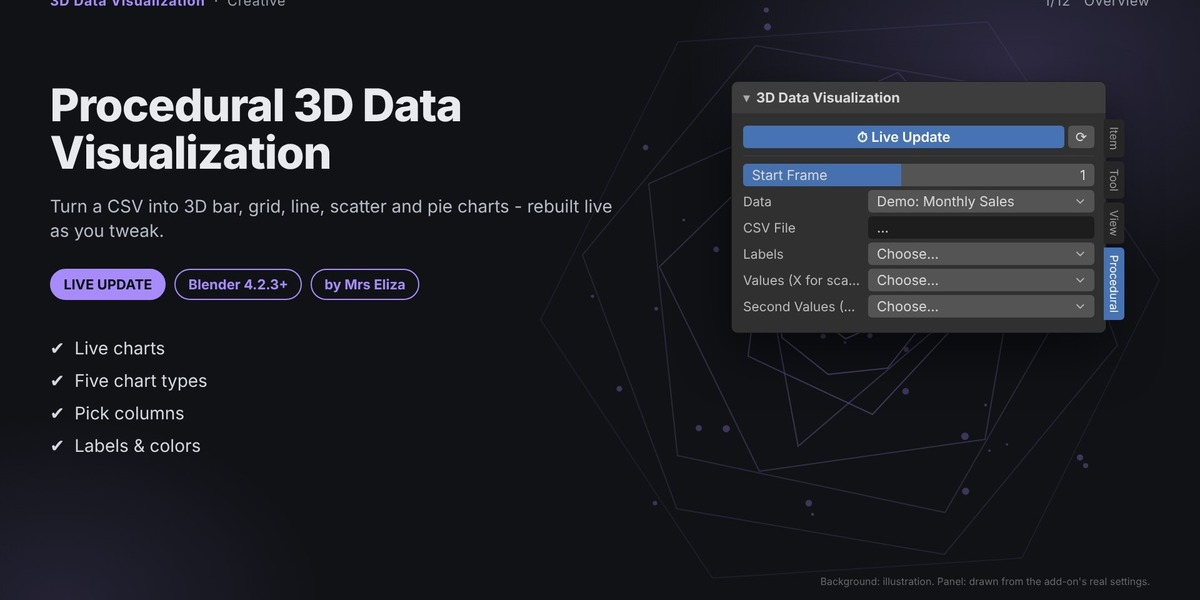
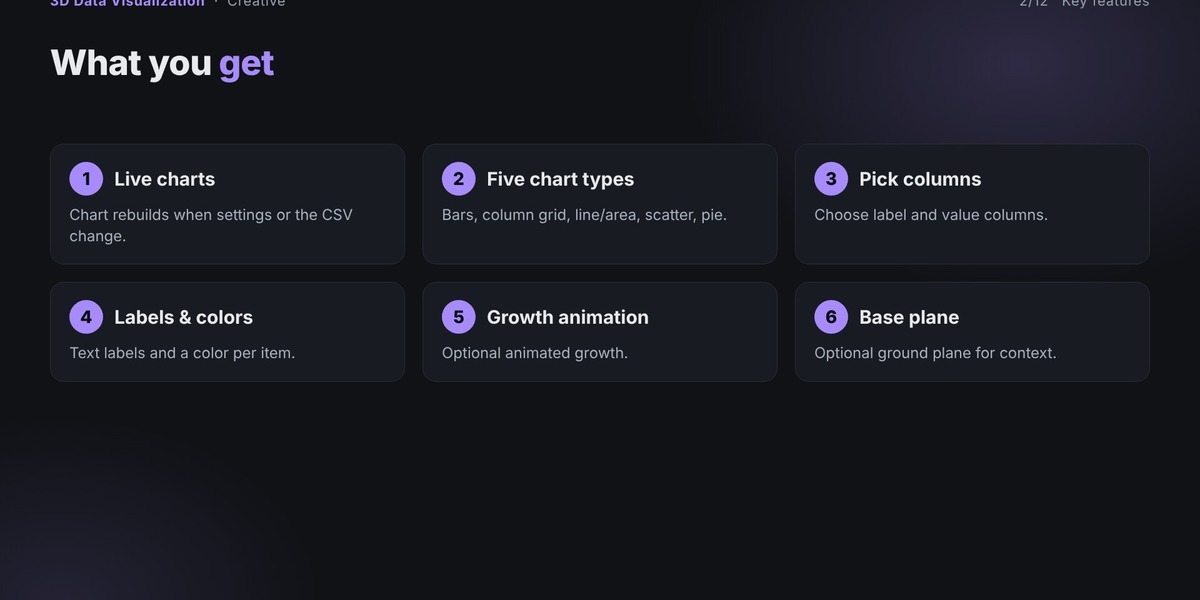
Procedural 3D Data Visualization transforms CSV data into customizable 3D charts directly inside Blender. Create professional-looking bars, line charts, scatter plots, pie charts, and heat grids using your own data.
Choose the CSV file, select the label and value columns, and customize the chart's appearance. You can add text labels, colors, materials, textures, and growth animations. Changes are rebuilt live as you adjust the settings.
Main Features
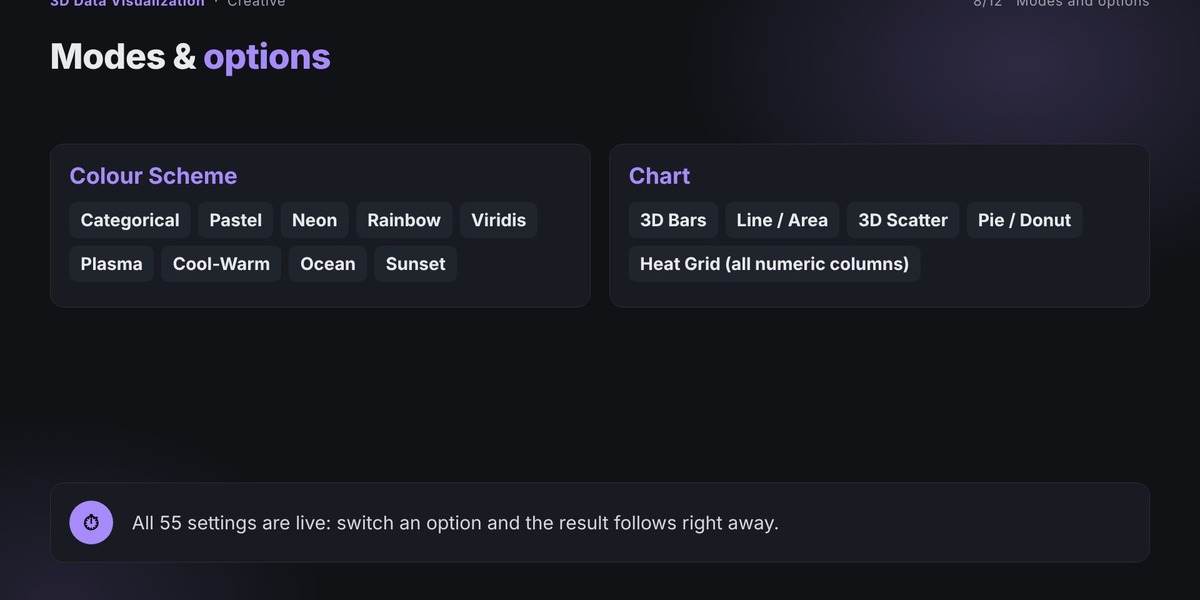
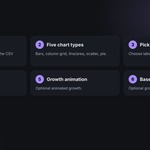
Create 3D Bars, Line / Area, Scatter, Pie / Donut, and Heat Grid charts.
Import data directly from CSV files.
Customize chart dimensions, shapes, spacing, and colors.
Add labels, legends, axes, and gridlines.
Apply materials and procedural textures.
Animate chart growth and turntable rotation.
Use ready-made presets or save your own.
2. Important: Do not unzip the downloaded file before installation. If installation fails, make sure you selected the individual add-on ZIP rather than a bundle containing multiple add-ons.
3. Opening the Add-on
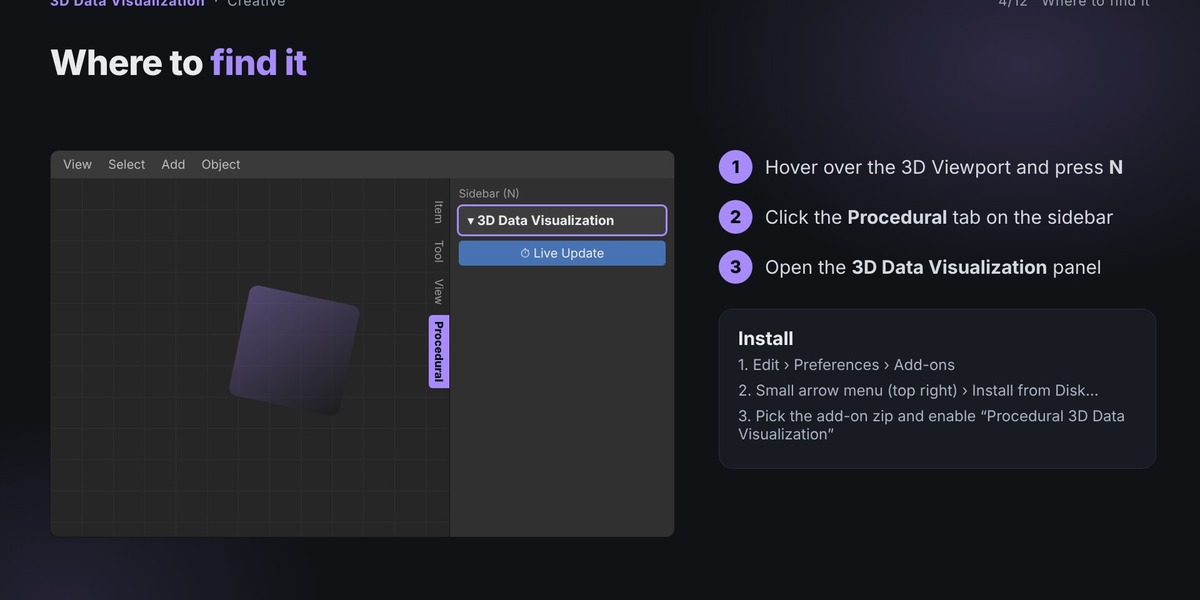
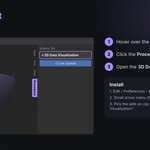
Move your cursor over the 3D Viewport.
Press N to open the sidebar.
Select the Procedural tab.
Find and expand 3D Data Visualization.
All Mrs Eliza procedural add-ons share this tab, so you may see multiple panels if you have other add-ons installed.
4. Creating Your First Chart
Follow these steps to generate your first visualization:
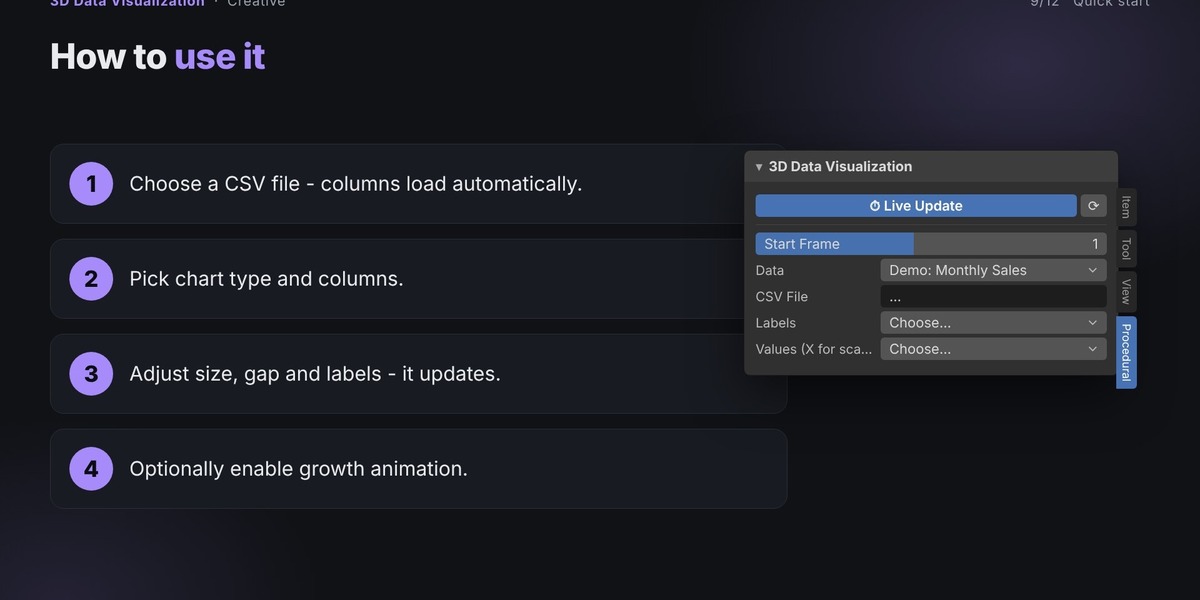
Choose a CSV file from the add-on panel.
Select the chart type.
Choose the column for labels and the column for values.
Adjust the chart width, height, depth, and gap.
Enable or disable text labels, value labels, and colors.
Optionally enable growth animation and configure its timing.
The chart is created at the 3D Cursor and updates as you change the settings.
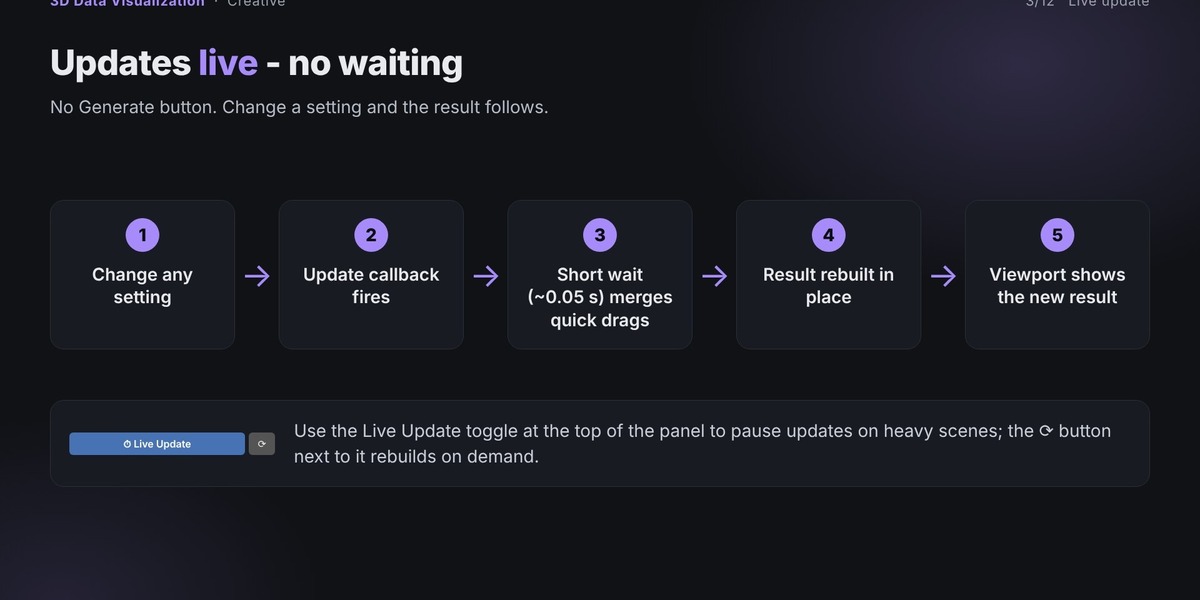
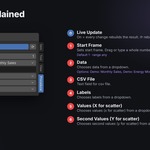
Live Update
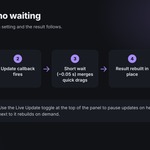
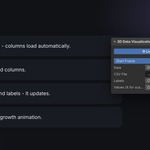
Live Update is enabled by default. Whenever you change a setting, the add-on automatically rebuilds the chart after a short pause. Quick slider adjustments are grouped into a single update.
Use the circular-arrow button to rebuild manually when Live Update is disabled.
The chart is maintained as one live object. Rebuilding preserves its position, rotation, scale, parent, and existing modifiers.
Create New creates a separate live chart at the 3D Cursor without changing your previous result. This lets you explore different designs while keeping earlier charts.
5. One-Click Setup and Presets
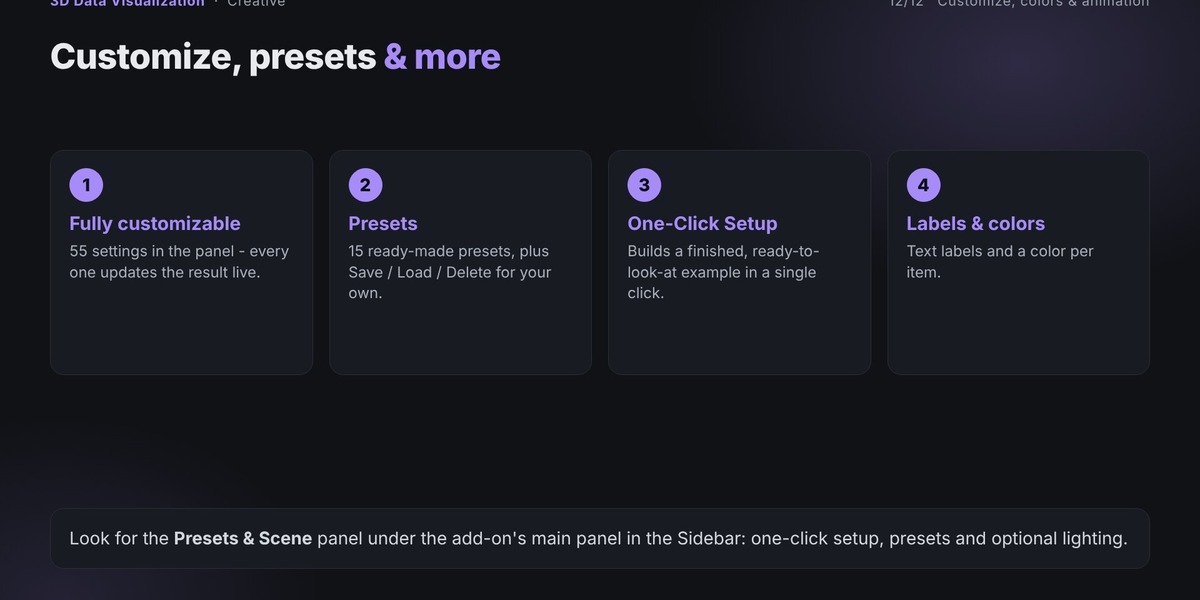
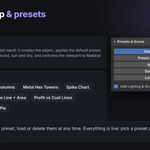
The Presets & Scene section provides a quick way to create a finished-looking visualization.
One-Click Setup
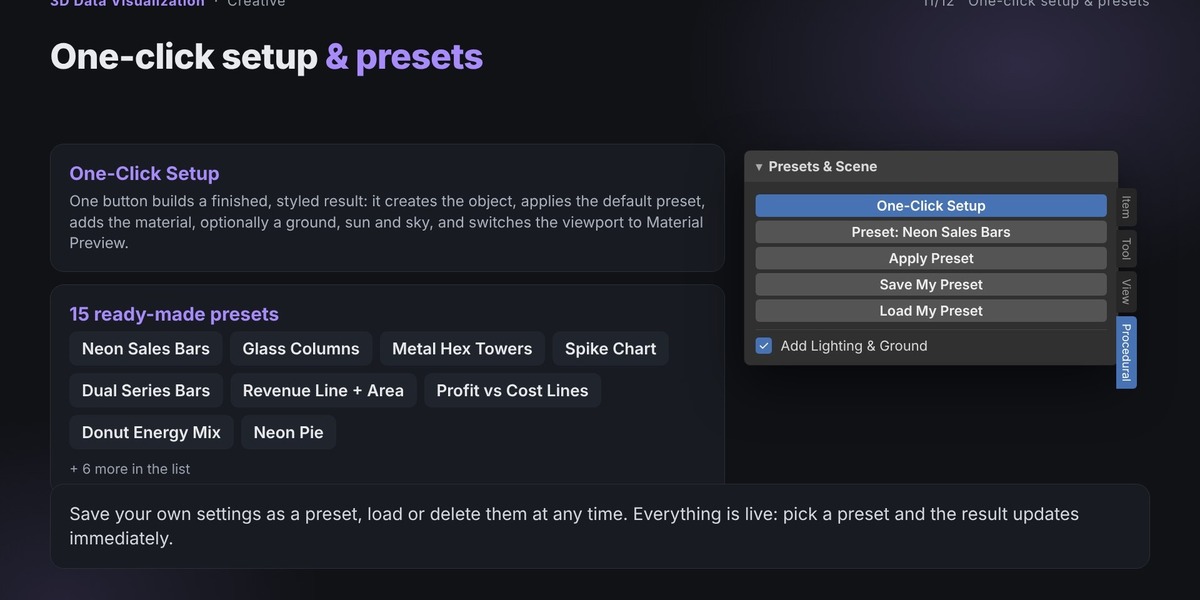
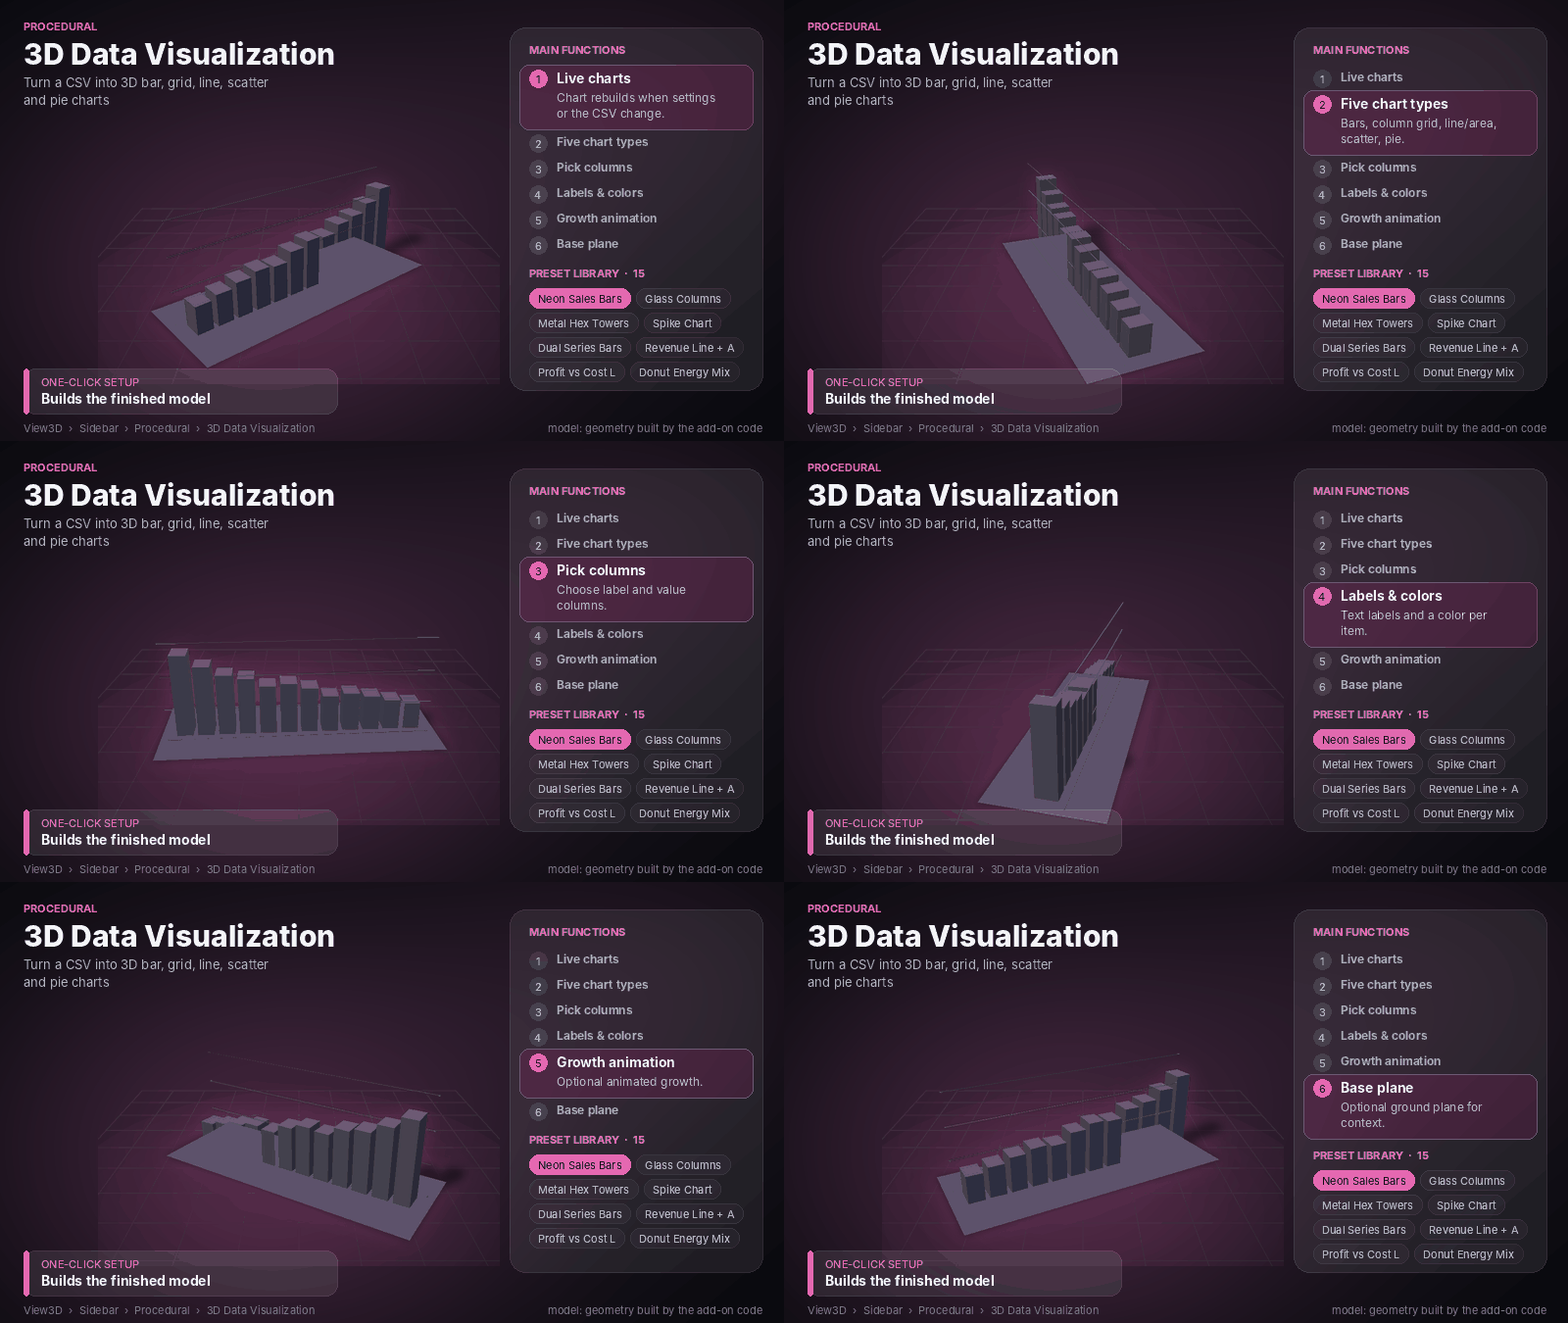
Click One-Click Setup to automatically:
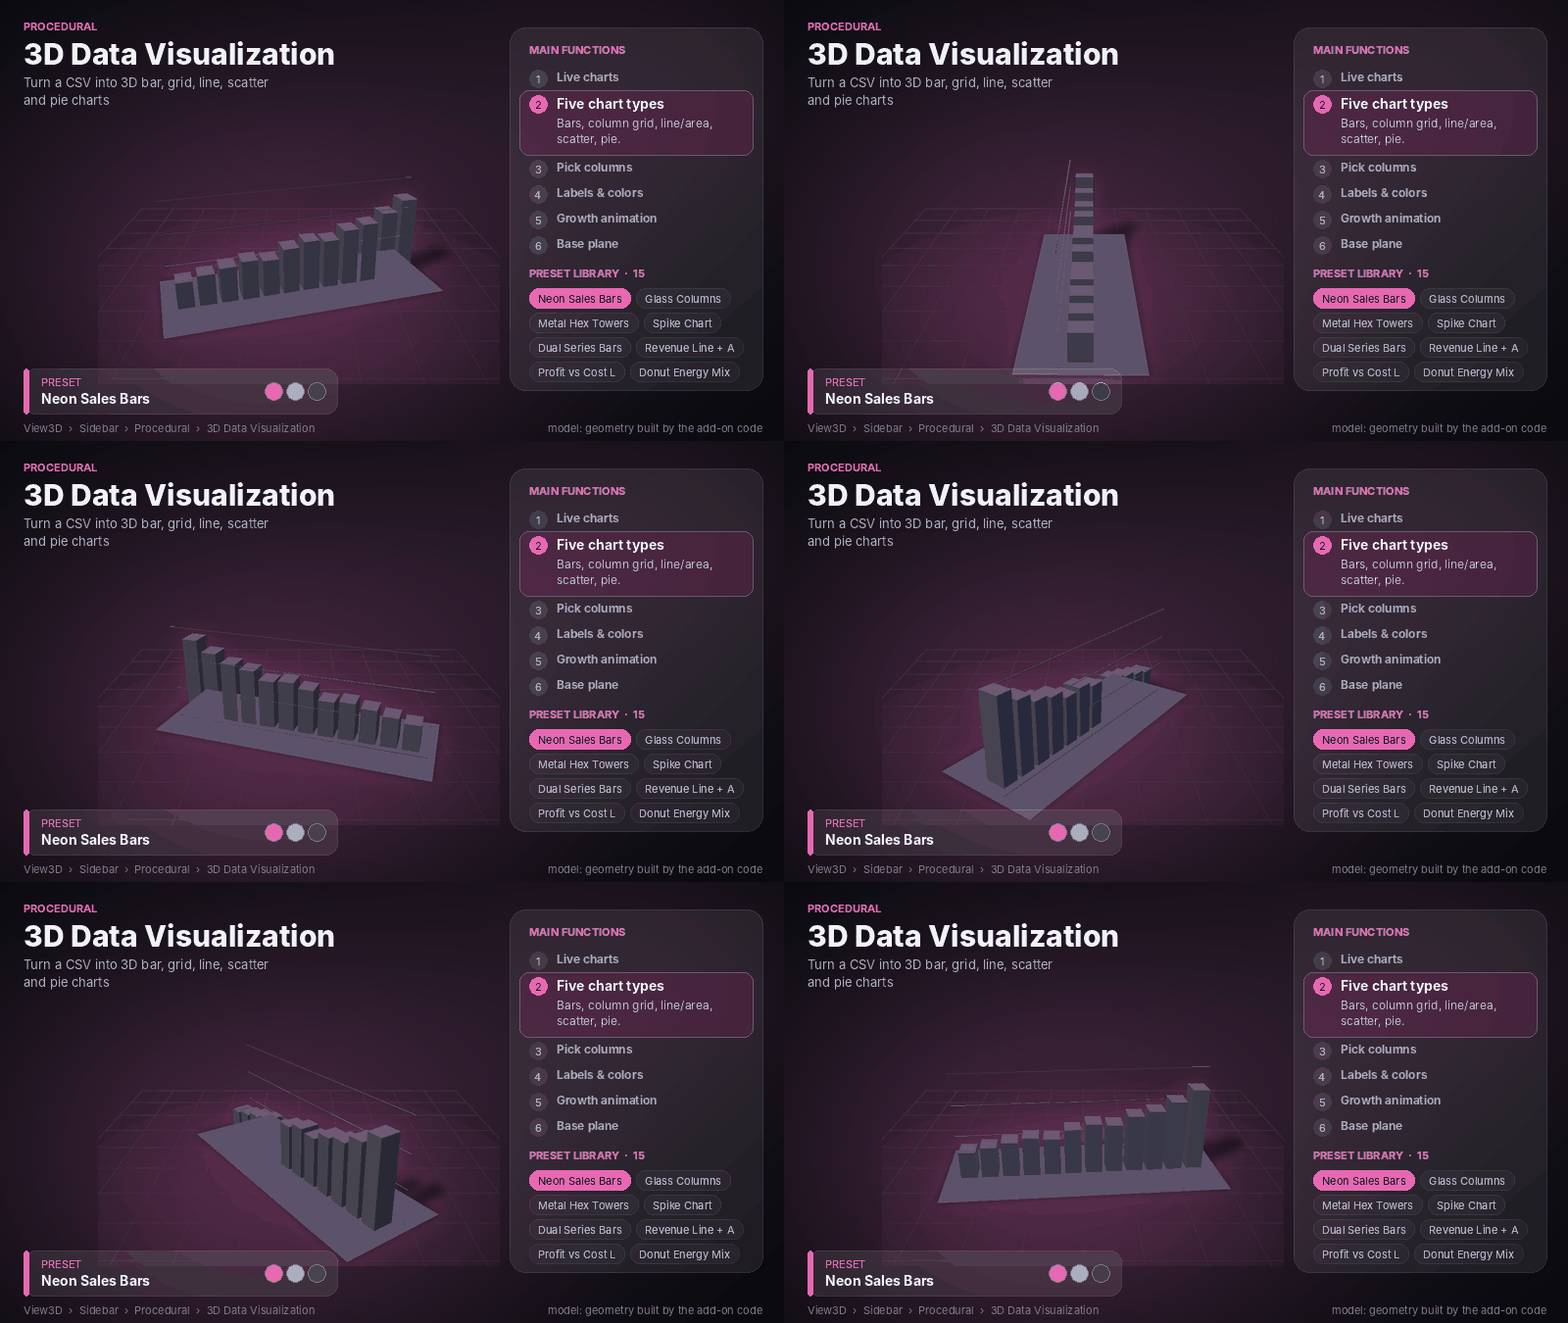
Apply the default Neon Sales Bars preset.
Create the required materials.
Optionally add a ground plane, Sun light, and sky color.
Switch the viewport to Material Preview.
Enable Add Lighting & Ground to include the lighting and ground setup.
Built-in Presets
The add-on includes 15 ready-made presets:
Neon Sales Bars
-
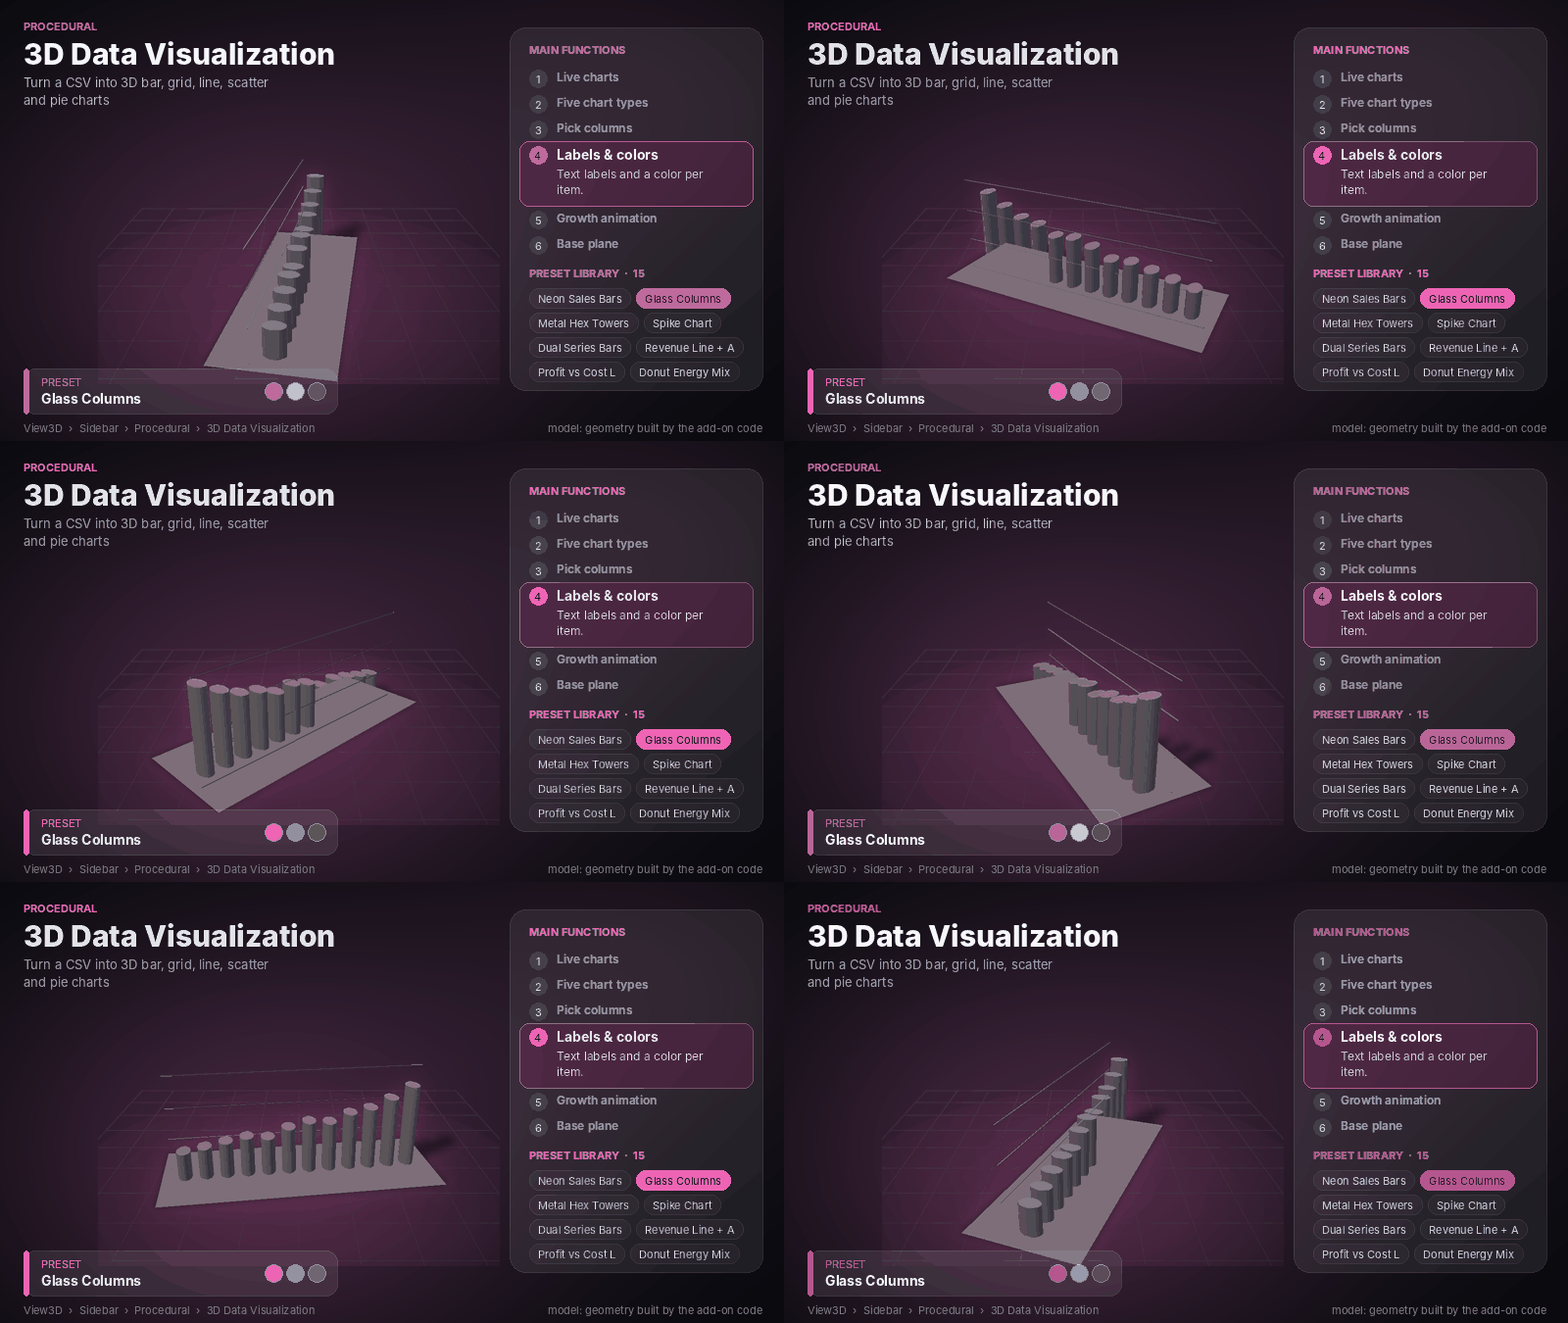
Glass Columns
Metal Hex Towers
Spike Chart
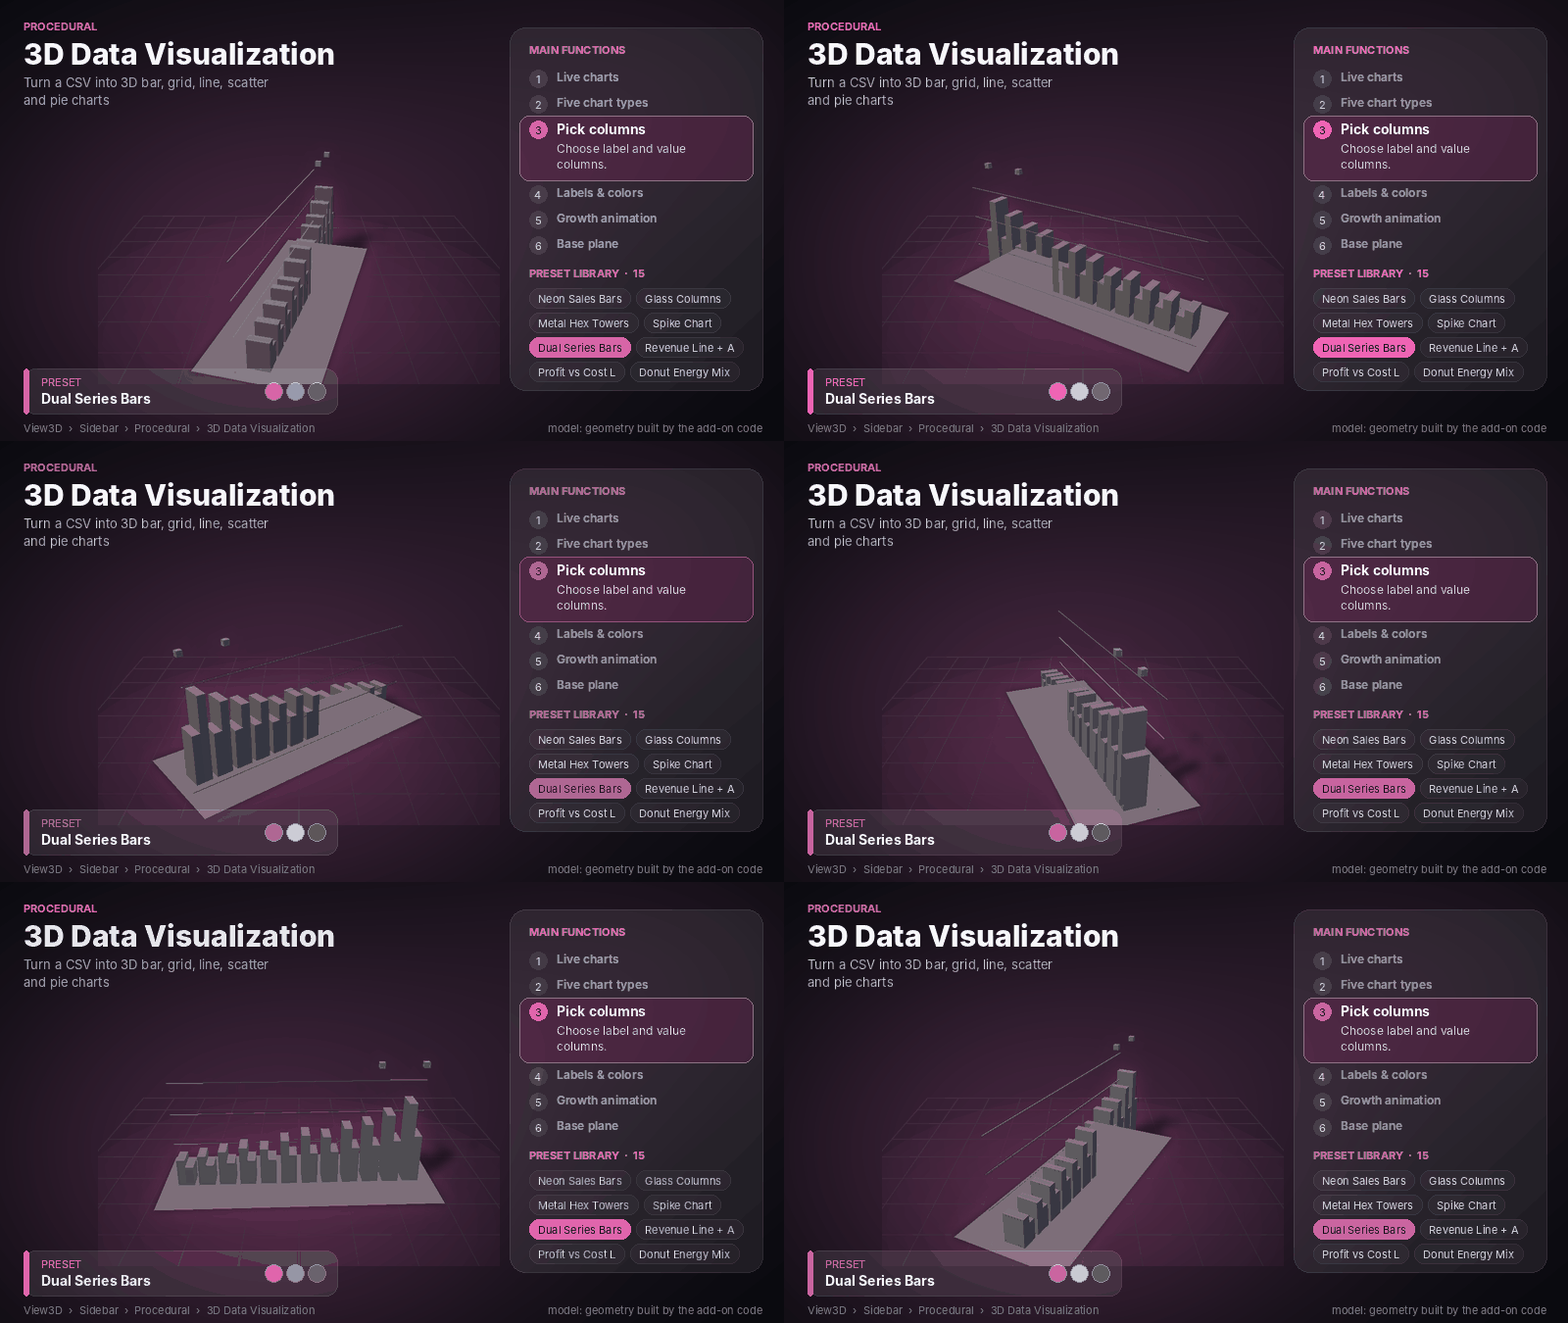
Dual Series Bars
Revenue Line + Area
Profit vs Cost Lines
Donut Energy Mix
Neon Pie
Scatter Bubbles
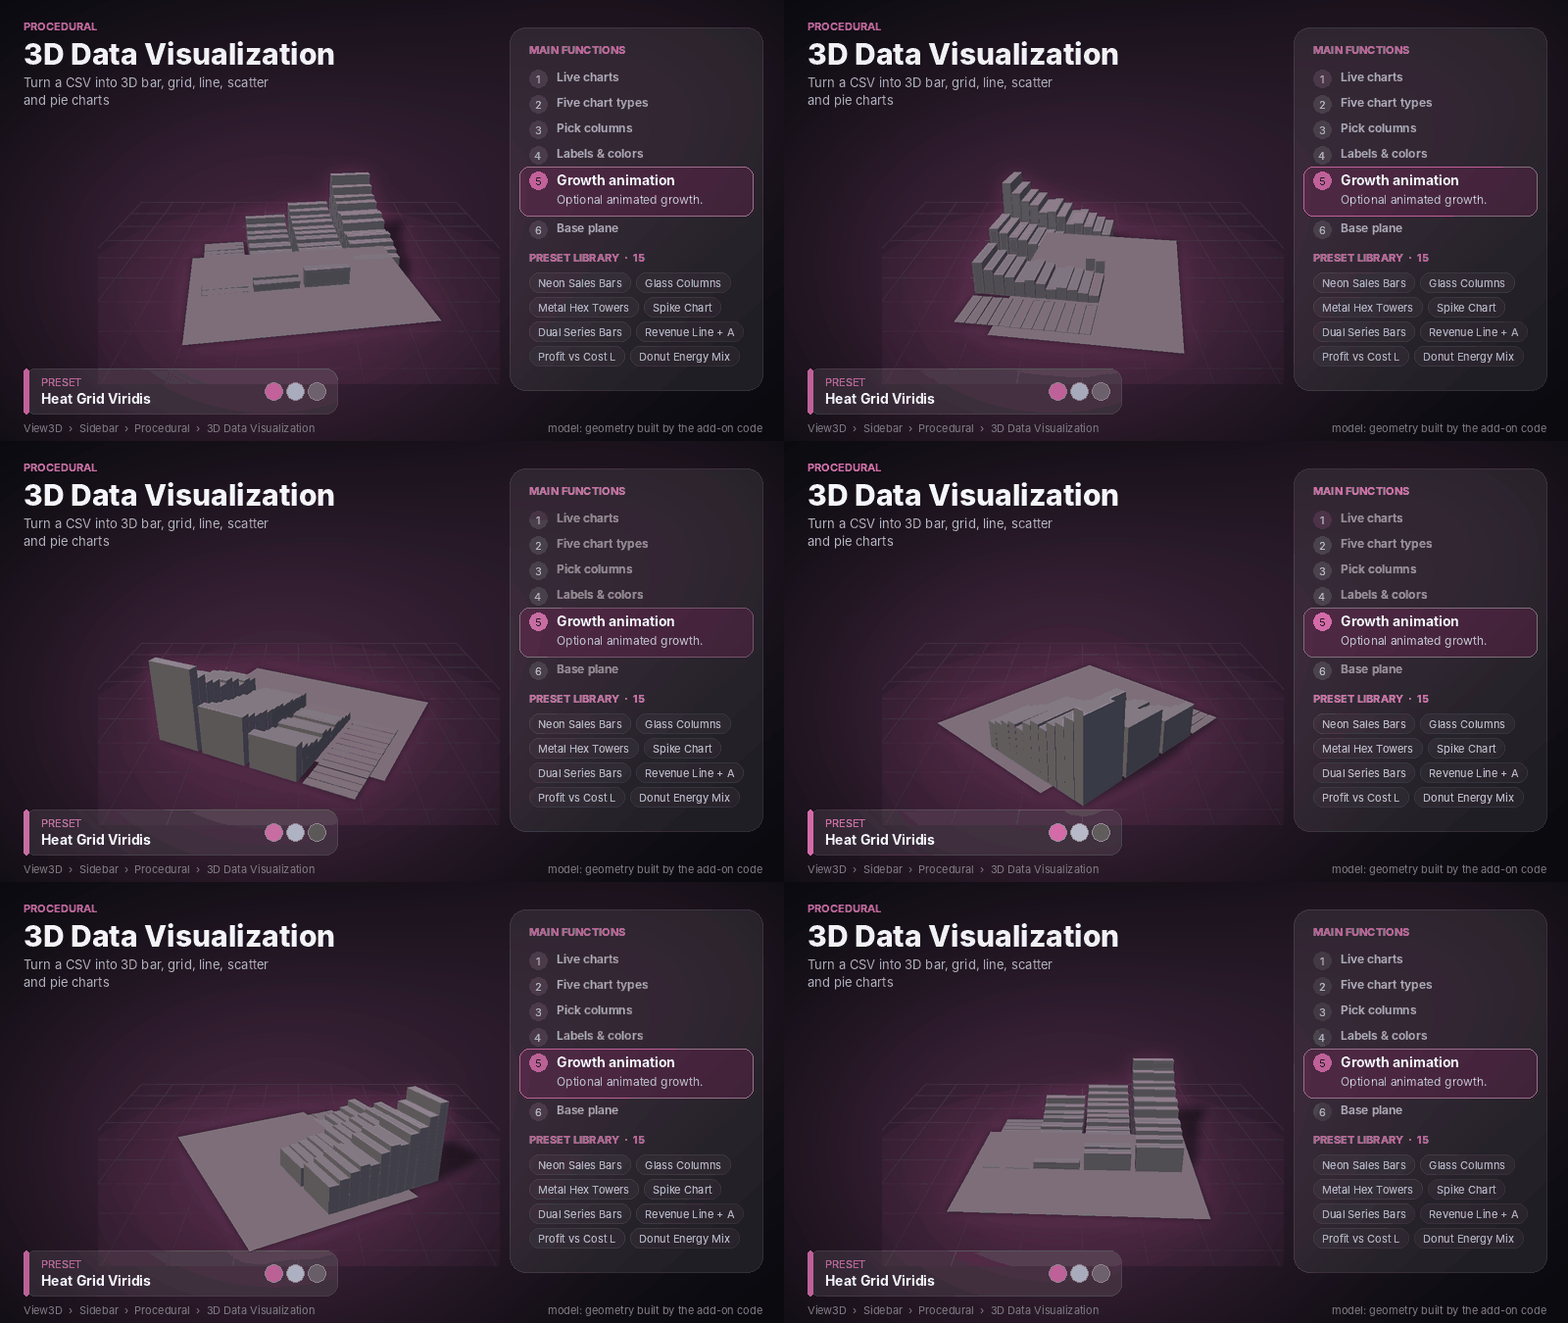
Heat Grid Viridis
Top 5 Ranking
Minimal Mono
Growth Showcase
-
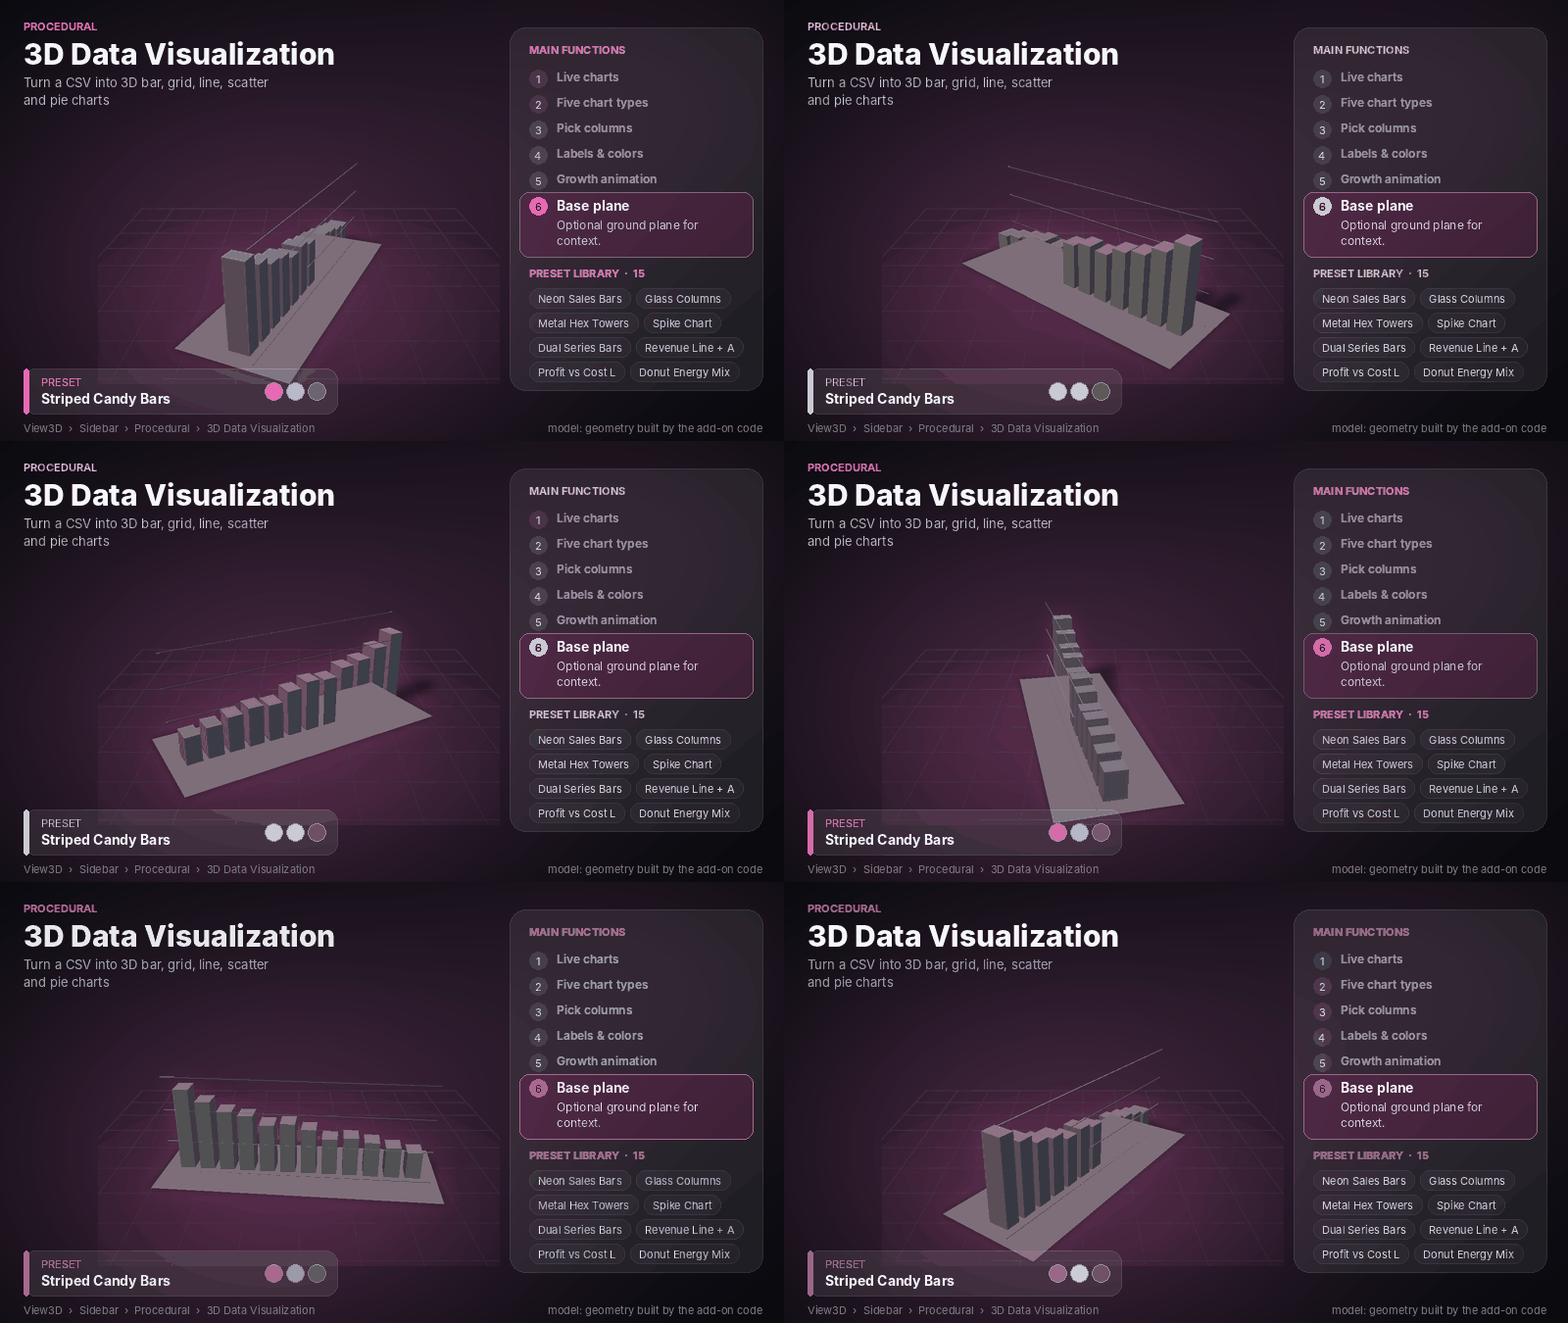
Striped Candy Bars
 0
Select a preset and click Apply Preset. The chart updates immediately, and you can continue adjusting its settings.
Custom Presets
Save your preferred settings for future projects.
Save My Preset: Save the current settings under a custom name.
Load My Preset: Load a previously saved preset.
Delete My Preset: Remove a saved preset.
Custom presets are stored in your Blender configuration folder and remain available across different .blend files.
6. Settings Guide
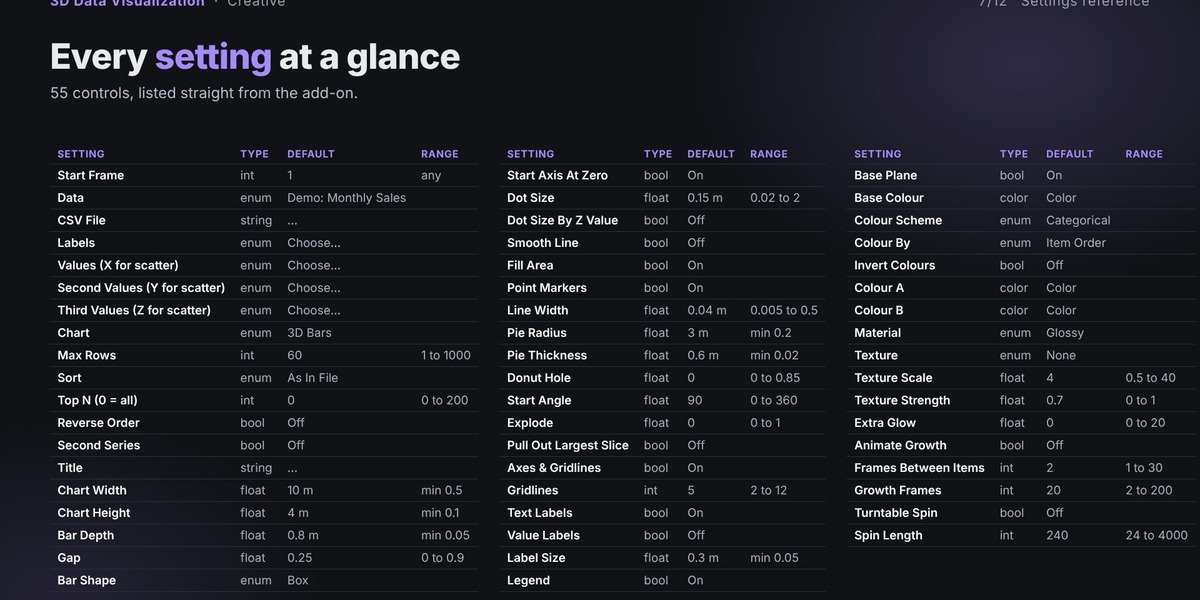
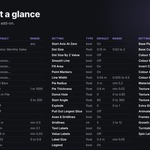
The add-on provides 55 settings for controlling the chart's data, shape, appearance, materials, and animation. Some controls appear only when their related chart type or mode is selected.
Data and Chart Selection
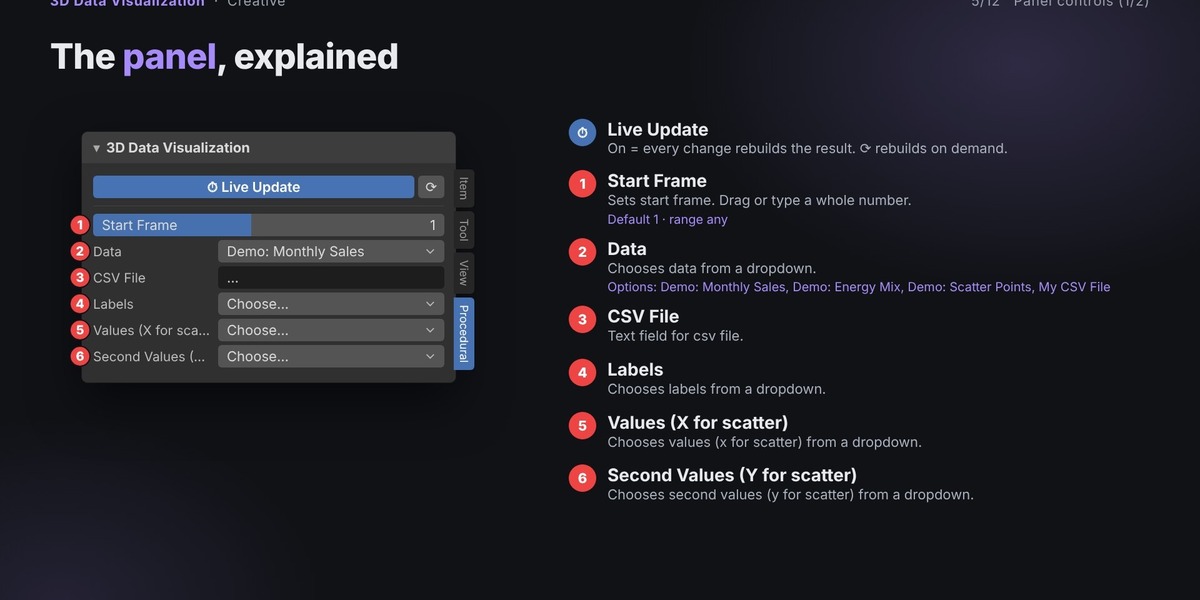
Data: Choose the data source:
Demo: Monthly Sales – Built-in revenue, costs, and profit data.
Demo: Energy Mix – Built-in data for pie and donut charts.
Demo: Scatter Points – Built-in X, Y, and Z coordinates.
My CSV File – Use your own CSV data.
CSV File: Specify your CSV file.
Labels: Select the column used for chart labels.
Values: Select the main numeric column. For scatter charts, this is the X value.
Second Values: Select the Y value for scatter charts or the second data series for supported charts.
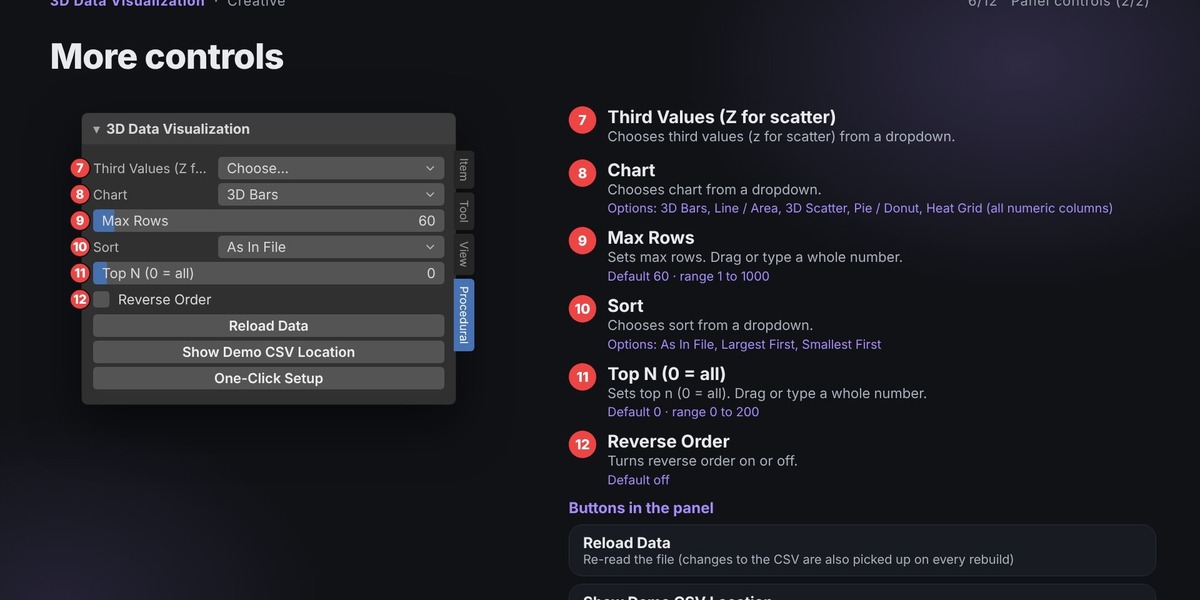
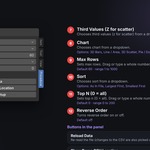
Third Values: Select the Z value for scatter charts.
Chart: Choose from 3D Bars, Line / Area, 3D Scatter, Pie / Donut, or Heat Grid.
Start Frame: Set the frame where the animation begins. The default is frame 1.
Data Filtering and Sorting
Max Rows: Set the maximum number of CSV rows to use. Default: 60; range: 1–1000.
Sort: Keep the original file order, sort largest first, or sort smallest first.
Top N: Display only the top number of entries. Set to 0 to include all entries; range: 0–200.
Reverse Order: Reverse the displayed item order.
Second Series: Compare the second value column using grouped bars or a second line.
Title: Enter a custom chart title.
Chart Dimensions and Shape
-
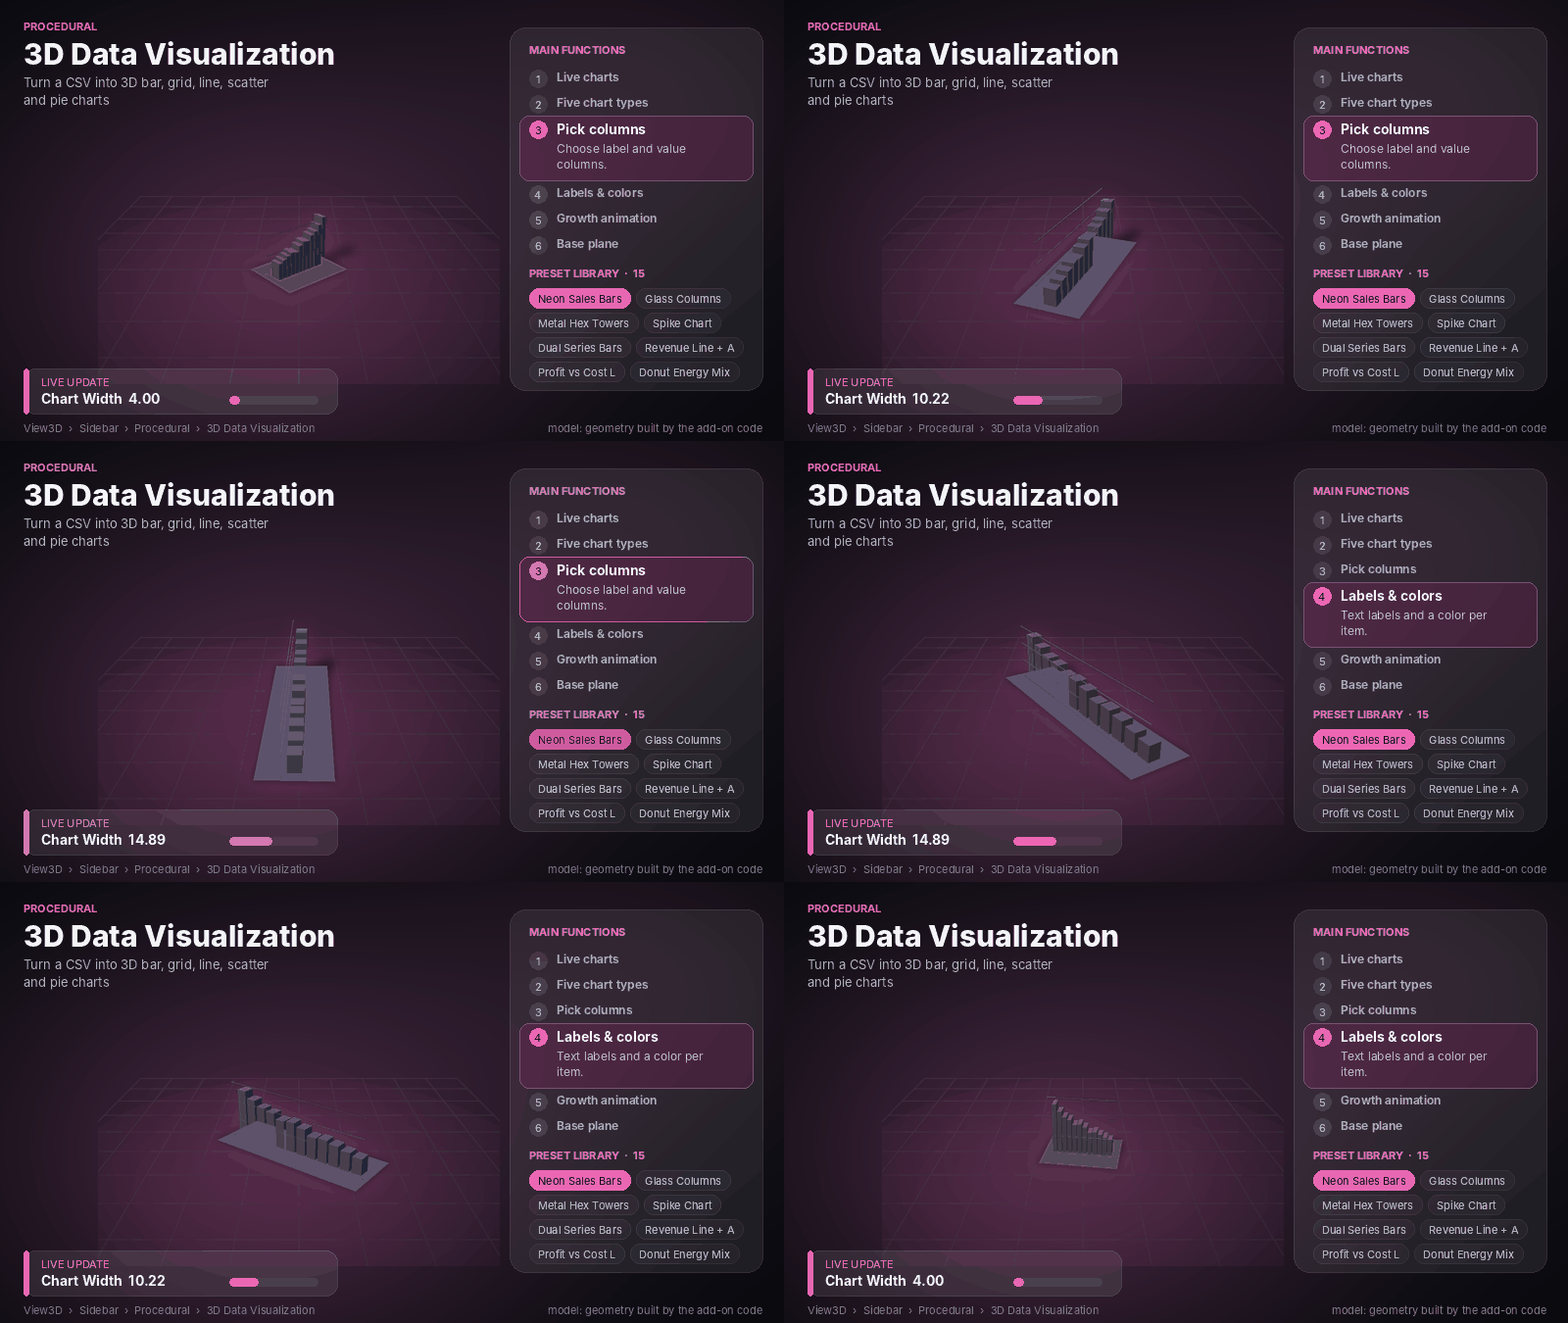
Chart Width: Control the overall chart width. Default: 10 m; minimum: 0.5 m.
-
Chart Height: Set the chart height. Default: 4 m; minimum: 0.1 m.
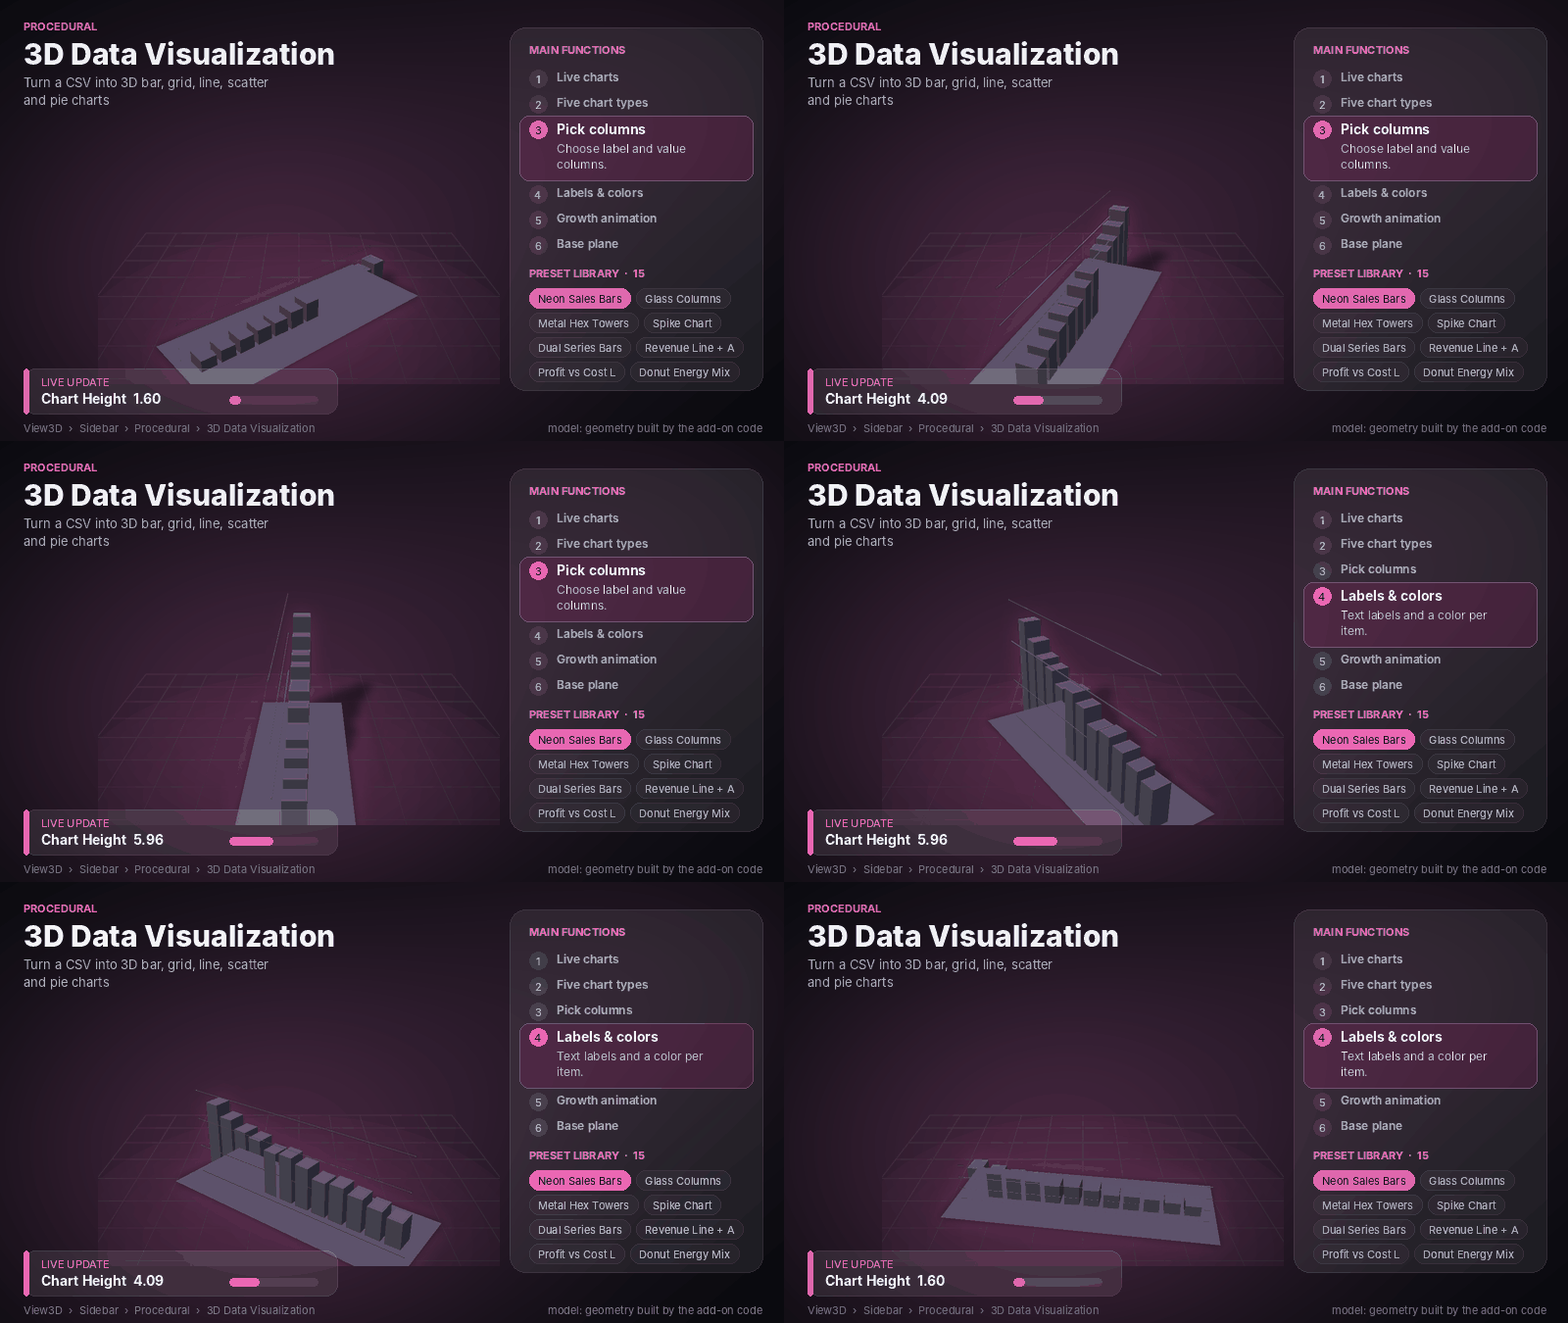
Bar Depth: Set bar depth. Default: 0.8 m; minimum: 0.05 m.
Gap: Adjust spacing between chart items. Default: 0.25; range: 0–0.9.
Bar Shape: Choose Box, Cylinder, Hexagon, or Cone / Spike.
Start Axis At Zero: Start the value axis at zero. Enabled by default.
Line and Scatter Settings
Dot Size: Set the size of scatter points. Default: 0.15 m; range: 0.02–2 m.
Dot Size By Z Value: Scale scatter points according to their Z values.
Smooth Line: Smooth the line chart.
Fill Area: Display a filled area beneath the line. Enabled by default.
Point Markers: Show markers at data points. Enabled by default.
Line Width: Adjust line thickness. Default: 0.04 m; range: 0.005–0.5 m.
Pie and Donut Settings
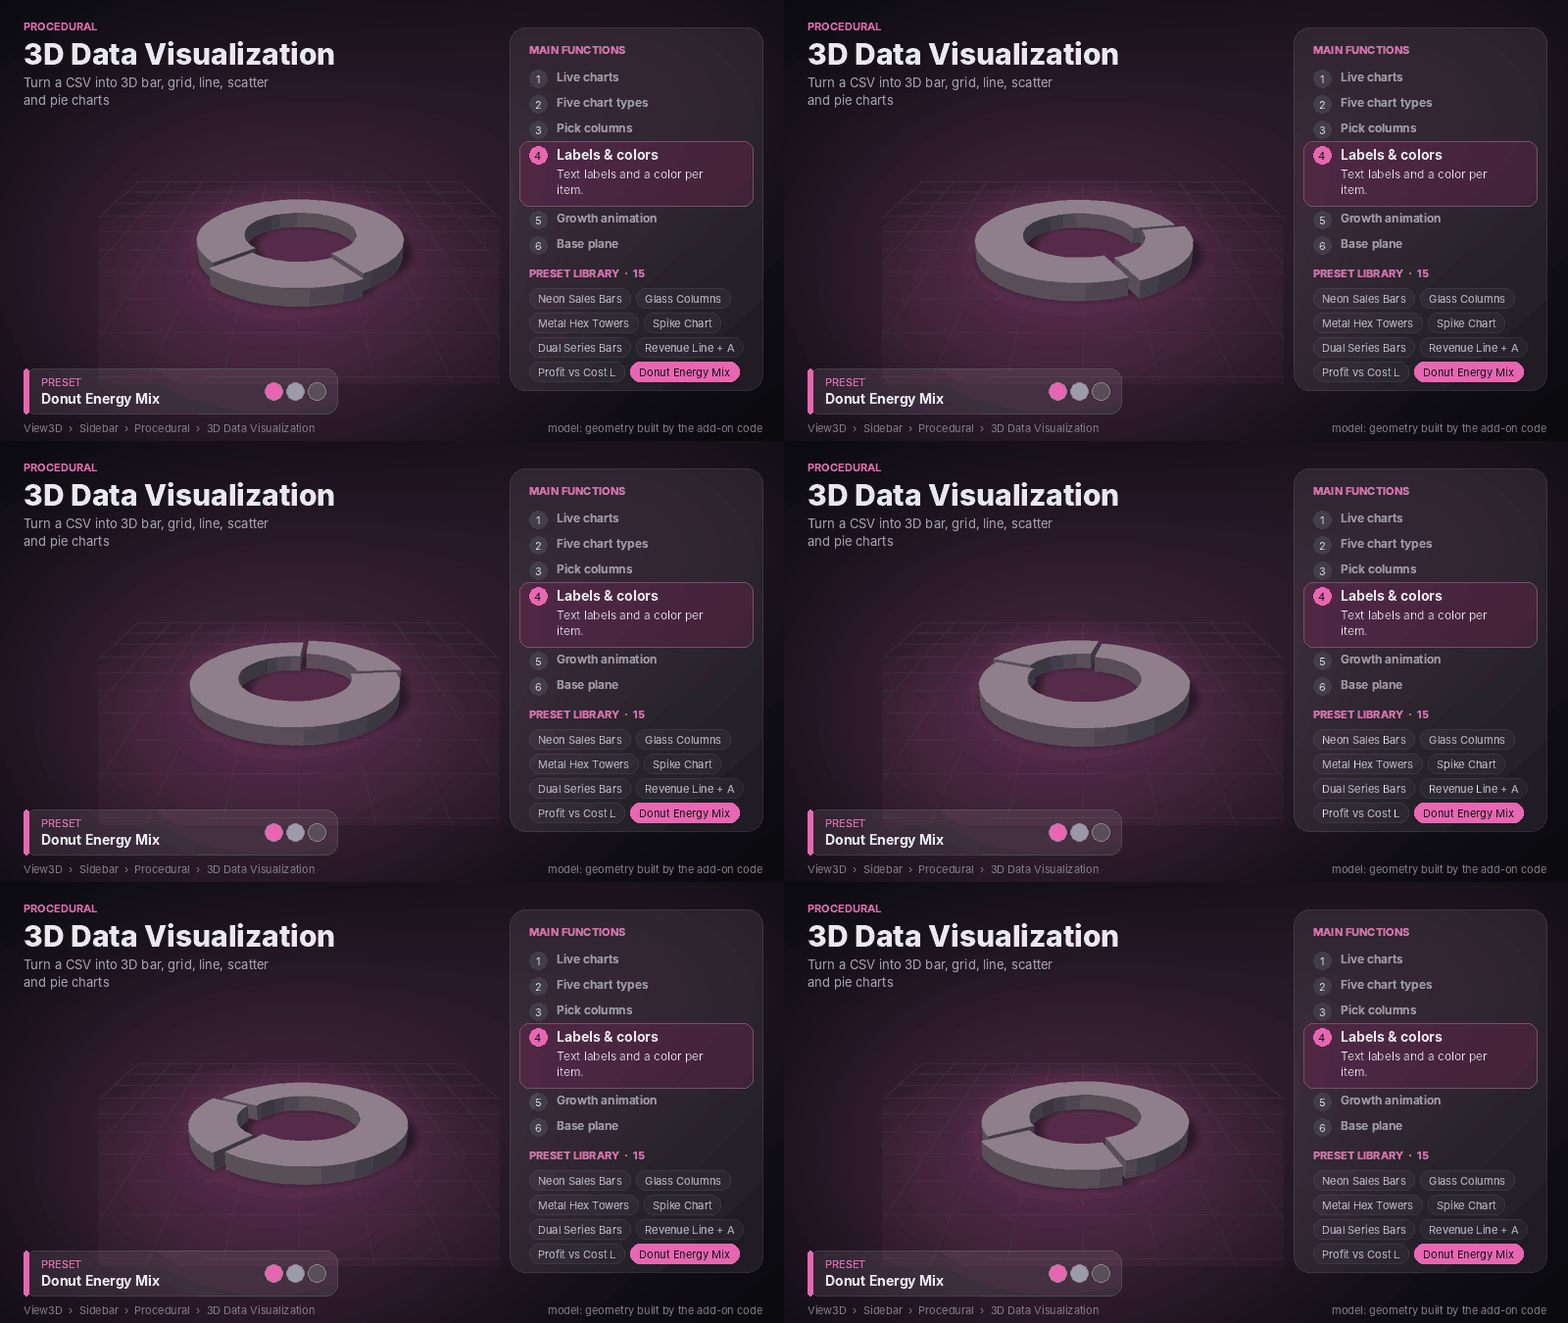
Pie Radius: Set the overall radius. Default: 3 m; minimum: 0.2 m.
Pie Thickness: Control the chart thickness. Default: 0.6 m; minimum: 0.02 m.
Donut Hole: Adjust the center opening. Range: 0–0.85; 0 creates a solid pie chart.
Start Angle: Rotate the starting position of the chart. Default: 90°; range: 0–360°.
Explode: Control how far the slices separate. Range: 0–1.
Pull Out Largest Slice: Separate the largest slice from the chart.
Axes, Labels, and Legend
Axes & Gridlines: Show or hide chart axes and gridlines.
Gridlines: Set the number of gridlines. Default: 5; range: 2–12.
Text Labels: Display category or item names. Enabled by default.
Value Labels: Display numerical values.
Label Size: Adjust label size. Default: 0.3 m; minimum: 0.05 m.
Legend: Show or hide the chart legend.
Base Plane: Add or remove the chart's base plane.
Base Colour: Choose the base plane color.
Colors and Color Schemes
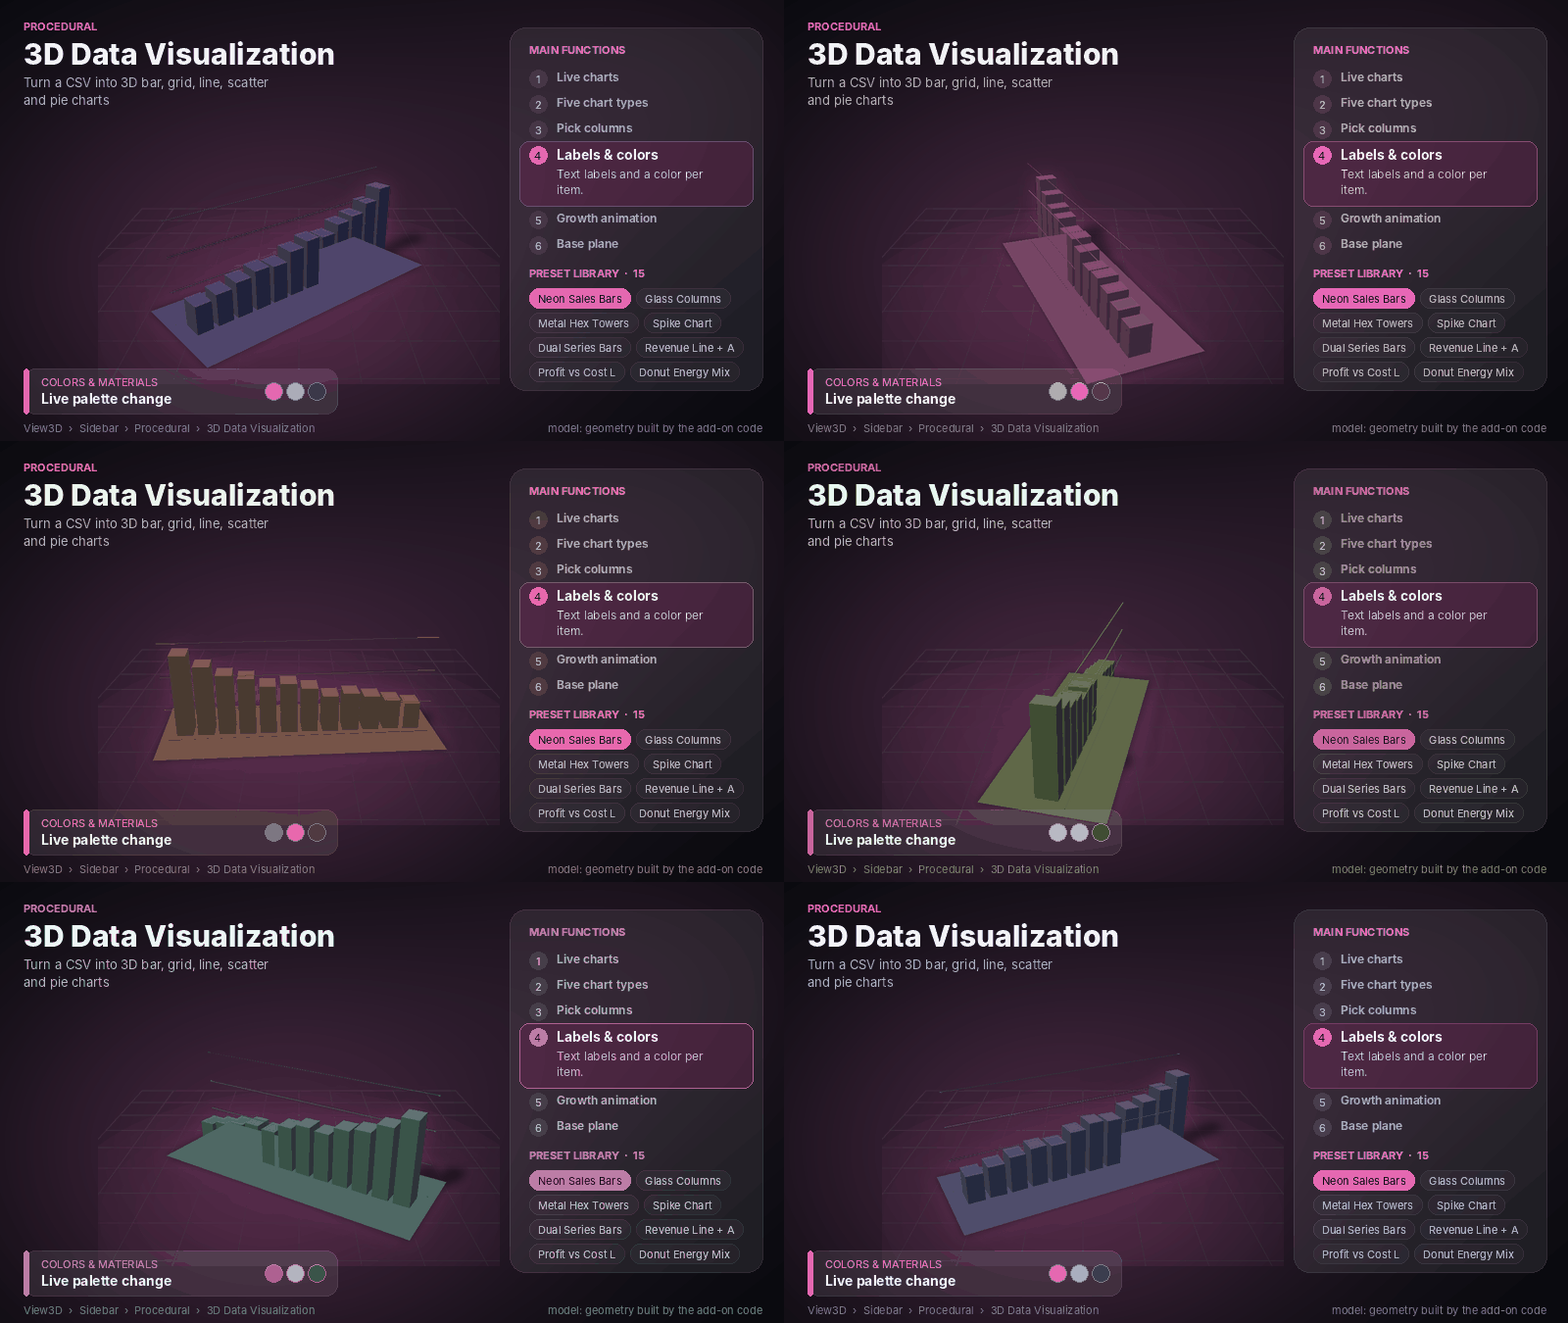
Colour Scheme: Choose from Categorical, Pastel, Neon, Rainbow, Viridis, Plasma, Cool-Warm, Ocean, Sunset, Forest, or Two Custom Colours.
Colour By: Choose how colors are assigned:
Item Order: Assign colors according to item position.
Value: Assign later colors to larger values.
Invert Colours: Reverse the color order.
Colour A and Colour B: Set the two custom colors used by the Two Custom Colours scheme.
Materials and Textures
Material: Choose the chart's surface appearance:
Glossy
Matte
Metal
Glass
Neon Glow
Texture: Apply a procedural texture:
None
Fade Toward Base
Stripes
Mottled
Checker
Texture Scale: Control texture size. Default: 4; range: 0.5–40.
Texture Strength: Adjust texture intensity. Default: 0.7; range: 0–1.
Extra Glow: Add additional glow to the chart. Default: 0; range: 0–20.
Animation Settings
Animate Growth: Animate chart items as they appear. Disabled by default.
Frames Between Items: Set the delay between each item. Default: 2; range: 1–30 frames.
Growth Frames: Set the growth animation duration. Default: 20; range: 2–200 frames.
Turntable Spin: Make the entire chart rotate slowly.
Spin Length: Set the duration of one turntable rotation. Default: 240; range: 24–4000 frames.
7. Panel Buttons and Actions
The main panel includes several useful actions:
Reload Data: Re-read the CSV file. Changes to the CSV are also picked up during the next rebuild.
Show Demo CSV Location: Display the location of the built-in demo CSV files so you can use them as templates.
One-Click Setup: Build a complete example using the selected preset and scene setup.
Apply Preset: Apply the selected preset, including its settings, colors, material, and animation.
Add Lighting & Ground: Add a ground plane, Sun light, and sky color.
Save My Preset: Save your current settings for future use.
Load My Preset: Load a saved custom preset.
Delete My Preset: Delete a saved custom preset.
8. Tips for Better Results
Use a header row: The first row of your CSV file is read as column names.
Keep charts readable: Reduce the number of rows if the chart becomes crowded.
Use a zero-based axis: Enable Start Axis At Zero for accurate bar-height comparisons.
Update changed data: Save your CSV file and click Reload Data to load the latest changes.
9. What Can You Create?
The add-on is useful for a variety of visualization projects, including:
Reports and infographics
Data journalism
Business presentations
Motion graphics
Animated data comparisons
3D charts for creative projects
10. Troubleshooting
No chart appears.
Check that the CSV file path is correct and that the selected value column contains numerical data.
Labels overlap or become difficult to read.
Reduce the number of displayed rows or decrease the label size.
The scatter plot looks incorrect.
Scatter charts use separate columns for X, Y, and Z coordinates. Make sure the correct columns are selected, especially the second value column for the Y axis.
11. Important Notes
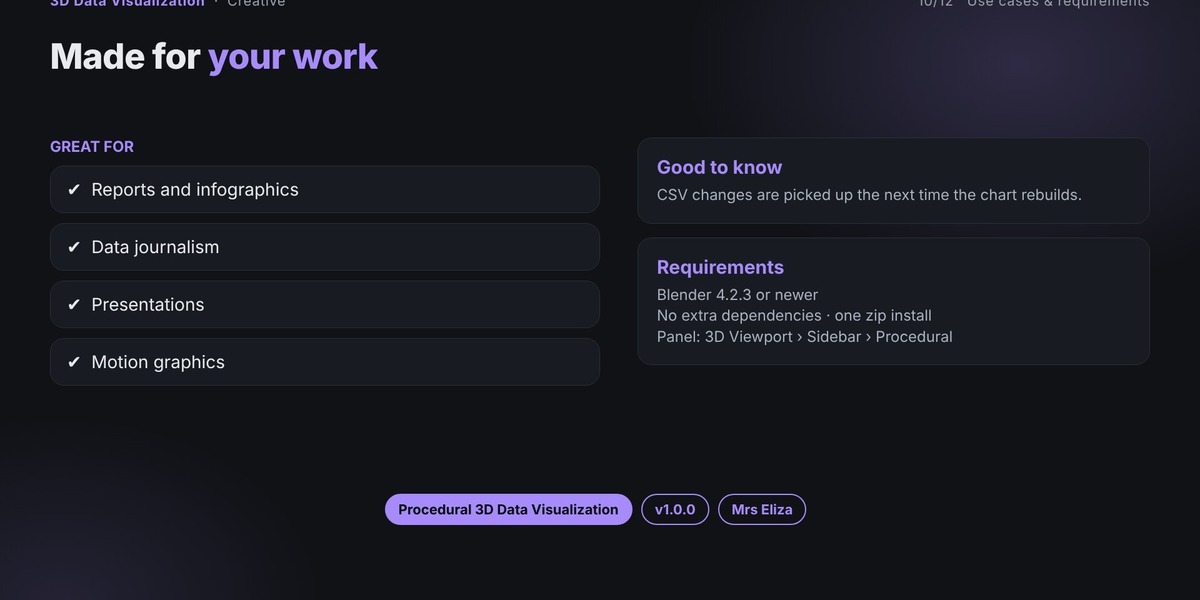
Changes made to a CSV file are loaded the next time the chart rebuilds.
Charts are created from separate objects organized under a root Empty.
Use Ctrl + Z to undo changes.
Saving your
.blendfile preserves everything created by the add-on.The add-on is not required to open a saved
.blendfile, but it is required to continue editing the chart live.
12. Support
When reporting a problem, please include:
Your Blender version.
The add-on name and version.
The steps you performed before the issue occurred.
The complete error message from the Info Editor or System Console.
Providing these details makes it easier to reproduce the problem and provide a solution.