 Skava
Skava



DrawCallAnalyzer — Know Your Draw Calls Before You Export
You built a beautiful scene. You exported it. And then your game engine told you the truth: too many draw calls, VRAM through the roof, frame rate in the single digits.
The problem is simple. Blender has no idea how a game engine will render your scene. Material slots, texture sizes, mesh duplication, overlapping geometry — none of it gets flagged until you hit Play and watch the profiler turn red.
DrawCallAnalyzer fixes that. It analyzes your Blender scene the way a game engine would and tells you exactly where the cost is — before you ever leave Blender. No round-trips to Unity or Unreal just to find out you're over budget.
Why It Matters
A single material slot is a draw call. A scene that looks fine in Blender can ship with 8,000 draw calls when the mobile budget is 200. By the time the engine profiler shows you that, you've already exported, imported, set up materials, and built lightmaps — hours of work before you learn the scene was never going to run. DrawCallAnalyzer moves that feedback to the start of the pipeline, where a fix costs minutes instead of a day.
How It Works
- Pick your platform. Desktop, Mobile, or Console — each loads a realistic draw-call and VRAM budget.
- Click Analyze. DrawCallAnalyzer walks every mesh, material slot, texture, and mesh duplicate in the scene.
- Read the breakdown. Draw calls, texture memory, batching and instancing opportunities, and an overdraw heatmap appear in the sidebar — each compared against your budget and flagged when you're over.
- Act on the suggestions. Merge these materials, instance those duplicates, downscale that 4K texture. Every suggestion comes with the exact saving it produces.
- Export with confidence. When the numbers are green, you know the scene will perform — before it ever reaches the engine.
Key Features
Draw Call Estimation Per Material
Every material slot on every object counts as one draw call. DrawCallAnalyzer totals them, breaks them down per material, and compares the result against your platform budget.
Static and Dynamic Batching Analysis
Objects that share a material can often be batched into a single draw call. The addon identifies static batching candidates (same material, combined vertex count under 64K) and dynamic batching candidates (same material, each object under 300 vertices). You see exactly how many draw calls each technique would save.
Mergeable Materials Detection
Materials with the same shader type and matching texture counts are flagged as merge candidates. Combining them into a texture atlas reduces your draw call count with zero visual loss.
Texture Memory Per Platform
Every image texture is sized for your target platform using real compression formats:
- Desktop: DXT1 (0.5 BPP), DXT5 (1.0 BPP), BC7 (1.0 BPP)
- Mobile: ASTC 4x4 (1.0 BPP), ASTC 6x6 (0.445 BPP), ETC2 RGB (0.5 BPP), ETC2 RGBA (1.0 BPP)
- Console: BC7 (1.0 BPP), BC5 (1.0 BPP), BC1 (0.5 BPP)
Mipmap overhead (33%) is included automatically. Large textures (4K+) are flagged with specific downscale recommendations.
GPU Instancing Detection
Objects that share the same mesh data are identified as instancing candidates. The addon calculates exactly how many draw calls instancing would eliminate and can tag each group with a custom property for easy export pipeline integration.
Overdraw Visualization
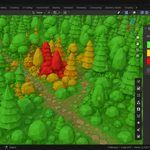
Bounding box overlap is evaluated from the active camera (or in 3D if no camera exists). Objects are color-coded green (low), yellow (medium), or red (high) directly in the viewport so you can spot problem areas at a glance.
Optimization Report — CSV / JSON Export
A single button generates a comprehensive report covering draw calls, texture memory, instancing groups, batching opportunities, and numbered optimization suggestions. Export it as CSV or JSON to share with your team, paste into a task tracker, or diff against a later snapshot.
Snapshot Diff
Save a snapshot of the scene's metrics, optimize, then compare. DrawCallAnalyzer shows you exactly how many draw calls and how much VRAM your changes saved — proof of progress, not guesswork.
Platform Budgets
| Platform | Draw Call Budget | VRAM Budget |
|---|---|---|
| Desktop | 5,000 | 2,048 MB |
| Mobile | 200 | 256 MB |
| Console | 3,000 | 1,024 MB |
Analysis results are compared against the selected platform budget and flagged if over.
Who Is This For
- Game artists who need to hit performance budgets before handing off to engineering
- Technical artists building production pipelines who need scene-level metrics
- Indie developers wearing every hat who cannot afford to profile after every export
- Environment artists working on open-world or mobile projects where every draw call matters
- Students learning game optimization who want to see the numbers behind the theory
What You Get
- The DrawCallAnalyzer add-on (single ZIP, install via Preferences)
- Sidebar panels for draw calls, textures, instancing, overdraw, and reports
- CSV and JSON report export
- Free updates for the 1.x series
FAQ
Does it need an internet connection?
No. Everything runs locally inside Blender. No account, no telemetry.
Are the draw-call numbers exact?
They're a faithful estimate based on the same rules engines use (one draw call per material slot, batching by shared material, instancing by shared mesh). Real engine numbers vary with shader variants and dynamic lighting, but the relative picture — where your cost is and what to fix — is accurate.
Which engines does it target?
The analysis is engine-agnostic. The platform presets map to common Unity / Unreal / Godot budgets, but the metrics (draw calls, VRAM, batching, instancing) apply to any real-time renderer.
Does it modify my scene?
Analysis is read-only. The only optional write is the instance-group tagging (a custom property), which you trigger explicitly and which never changes geometry.
Will it work on my Blender version?
Blender 3.0 through 4.4+. No external dependencies.
Compatibility
- Blender 3.0 and newer (3.0+, 4.0+, 4.1+, 4.2+, 4.3+, 4.4+)
- Works with any render engine (analysis is mesh/material-based, not render-dependent)
- No external dependencies
Changelog
v1.0.0
- Initial release
- Draw call estimation with per-material breakdown
- Static and dynamic batching analysis
- Texture memory estimation for Desktop (DXT), Mobile (ASTC/ETC2), and Console (BC) formats
- GPU instancing detection and instance group tagging
- Overdraw visualization with camera-projected AABB overlap
- Comprehensive optimization report with CSV / JSON export
- Snapshot diff to measure optimization gains
- Platform budget comparison (Desktop, Mobile, Console)