 Skava
Skava


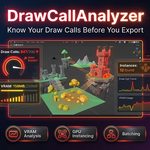
DrawCallAnalyzer — Documentation
v1.0.0 · Blender 3.2 + · Unity (URP / HDRP / Built-in) / Unreal 4-5 / Godot 4 · Windows / macOS / Linux
1. Install
- Download
drawcall_analyzer_v1_0_0.zip(do not unpack). -
Edit → Preferences → Add-ons → Install..., pick the ZIP, enable DrawCallAnalyzer. - Press
Nin the 3D Viewport → DrawCalls tab.
2. Quick start
- Pick a platform: Mobile / Console / Desktop.
- Pick scope: Scene or Selected Objects.
- (Optional) toggle Detect LODs + pick the active LOD level.
- Click Analyze Scene.
3. How draw calls are counted
One DC per used material_index per renderable mesh. A mesh with 5 slots but polygons using only slots 0 and 2 counts as 2 draw calls. hide_render + collection-level hide_render are respected.
This matches what Unity / Unreal / Godot actually submit. Addons that count per material_slot overestimate by 2-5×.
4. Batching candidates
- Static — meshes sharing a material with combined verts < 64,535. Skinned meshes excluded.
- Dynamic — meshes sharing a material with each < 300 verts.
-
GPU instancing — objects sharing the same
mesh.datacollapse to one draw per unique material.
5. LOD chain detection
Auto-detects _LOD0/LOD1/LOD2 naming (case-insensitive, _ or - separator). With Detect LODs on, only the active LOD level is scored. Warnings fire for:
- Misordered LODs — higher LOD has more verts than lower.
- Weak reduction — LOD saves < 10% verts vs previous level.
6. Platform presets
| Preset | DC budget | VRAM | Vertex warning |
|---|---|---|---|
| Mobile | 200 | 256 MB | > 65,535 → error |
| Console | 3,000 | 1 GB | > 65,535 → warning |
| Desktop | 5,000 | 2 GB | > 65,535 → warning |
7. Texture VRAM
Sums per-image size using platform-correct bits-per-pixel: Desktop (BC1/5/7, DXT, RGBA8), Mobile (ASTC, ETC2, PVRTC), Console (BC1/5/7). Per-texture breakdown sorted by size.
8. Overdraw heatmap
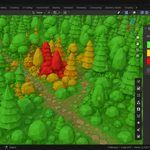
Counts AABB overlaps per object via a 16×16×16 spatial hash (replaces old O(n²) loop). Camera-aware when a scene camera is set. Tints viewport object color green (LOW ≤1 overlap) / yellow (MEDIUM ≤3) / red (HIGH ≥4). Use Clear Overdraw Colours to restore.
9. Report export
Export Report writes the last analysis as JSON (machine-readable) or CSV (Summary + Per-material + Instancing groups + Suggestions sections). Pin to a PR, diff between runs.
10. Snapshot & Compare
Snapshot stores current analysis on the scene. Compare shows the delta vs that snapshot. Useful for tracking optimization wins.
11. Troubleshooting
Numbers don't match Unity Frame Debugger — DCA scores 3D scene geometry only. Real-time lights, shadow passes, post-processing, UI canvases add extra DCs that DCA doesn't model. For the 3D portion, ±5% accuracy.
Overdraw all red — AABB overlap over-counts for L-shaped / hollow geometry. First-pass triage tool, not pixel-accurate.
LOD detection misses my naming — regex expects _LOD or -LOD at end of name. Spaces don't match.
Export Report: nothing to export — run Analyze Scene first.
12. Limitations
- Particle systems and hair are not analysed.
- Real-time lights, shadow passes, post-processing not modelled.
- SRP Batcher savings not auto-detected (engine-specific).
- Overdraw via AABB overlap over-counts on hollow geometry.
13. Support & License
Through marketplace messaging. GPL-3.0.
Have questions about this product?
Login to message
| Published | 3 months ago |
| Blender Version | 3.1 - 5.1 |
| Extension Type | N/A |
| Render Engine Used | Arnold, Blender-Internal, Blender-Game-Engine, Cycles, Eevee, Freestyle, Luxrender, Mental-Ray, Octane, Vray, Yafaray |
| License | GPL |
Discover more products like this
godot gpu instancing draw-call unreal batching vram overdraw performance unity profiler ue5 optimization