Blender Render Guard — Smart Crash Prevention & Optimizer
 NovaStrikes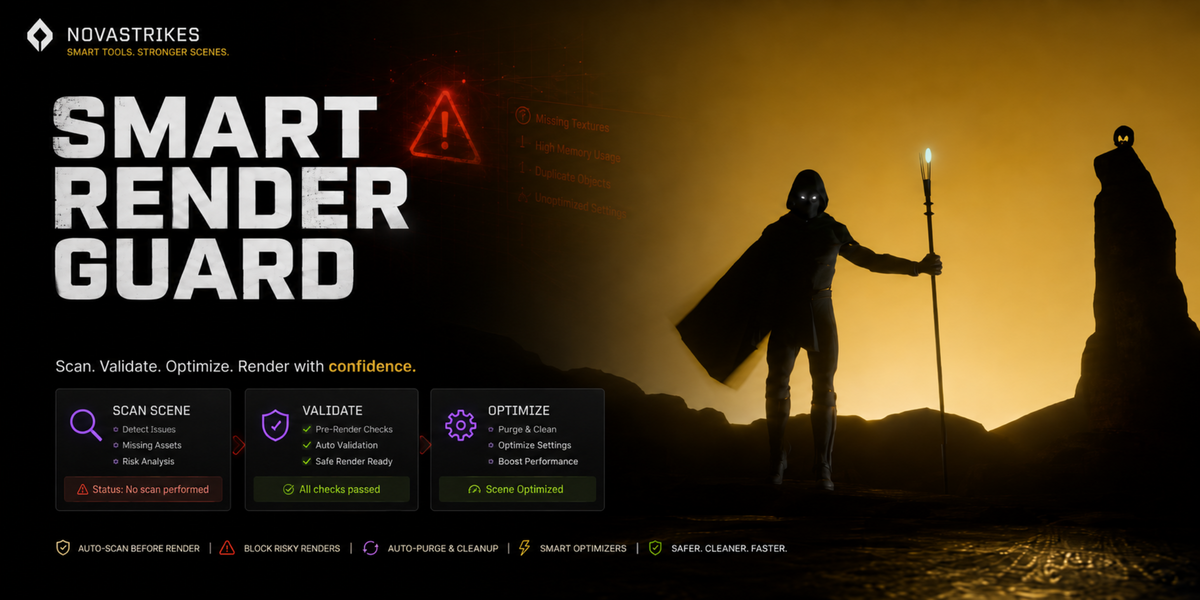
Smart Render Guard — Documentation
Everything you need to install, run, and understand what Smart Render Guard actually does to your scene. A downloadable step-by-step PDF is also linked at the bottom.
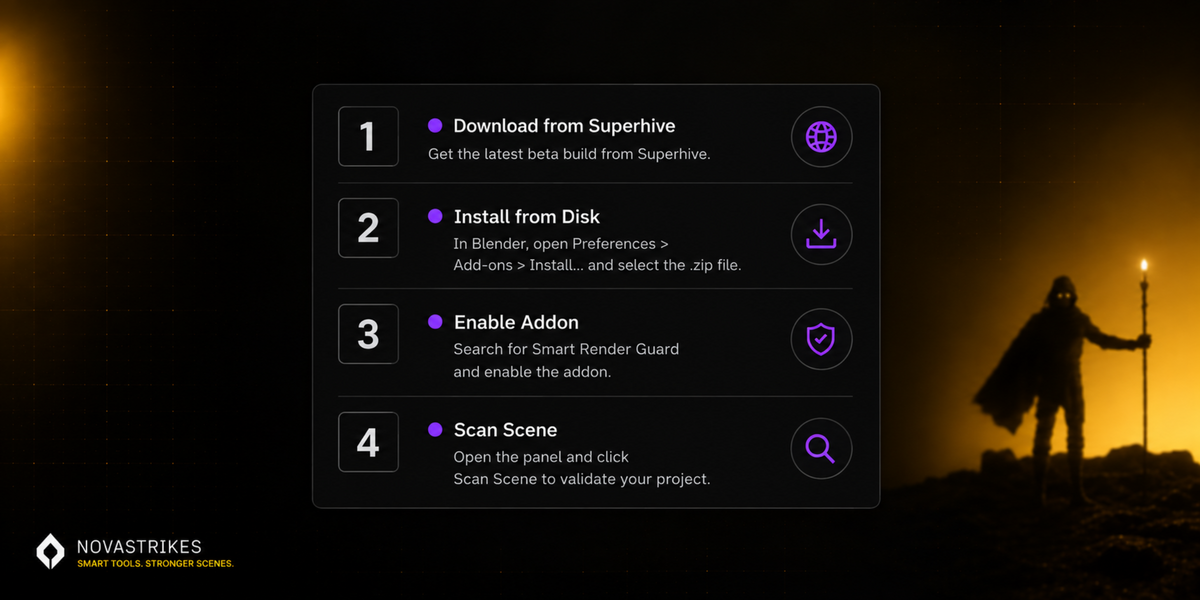
1. Installation
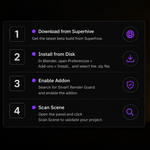
- Download
smart_render_guard_pro.zipfrom Superhive. Do not unzip it. - In Blender, go to Edit → Preferences → Add-ons
- Click Install from Disk, select the zip file
- Enable the checkbox next to Smart Render Guard in the list
- Close Preferences — the add-on is now active for this Blender install
Supports Blender 4.0 through 5.2, on Windows, macOS, and Linux. Only install one of Lite or Pro at a time — running both together isn't supported.
2. Where to find the panel
Smart Render Guard shows up in two places, and both control the same underlying tool:
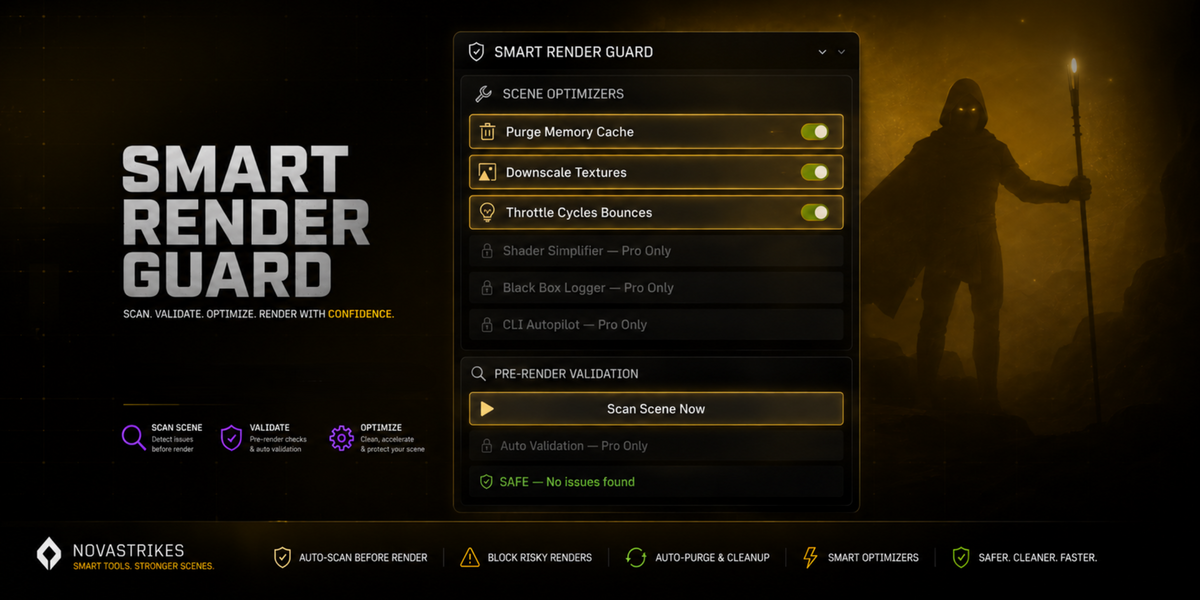
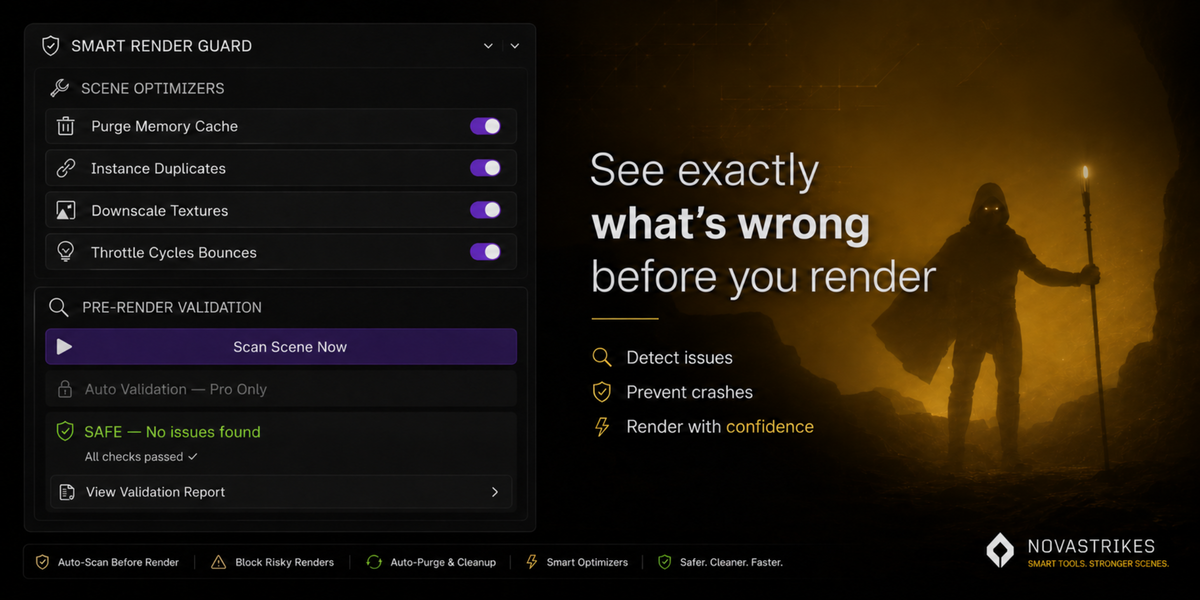
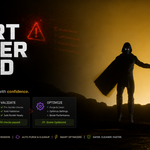
Press N in the 3D Viewport, then open the Render Guard tab. This is the full panel with scan results, all optimizers, and settings.
A condensed version lives under Properties → Render → Smart Render Guard, for quick access without opening the N-Panel.
3. Scanning a scene
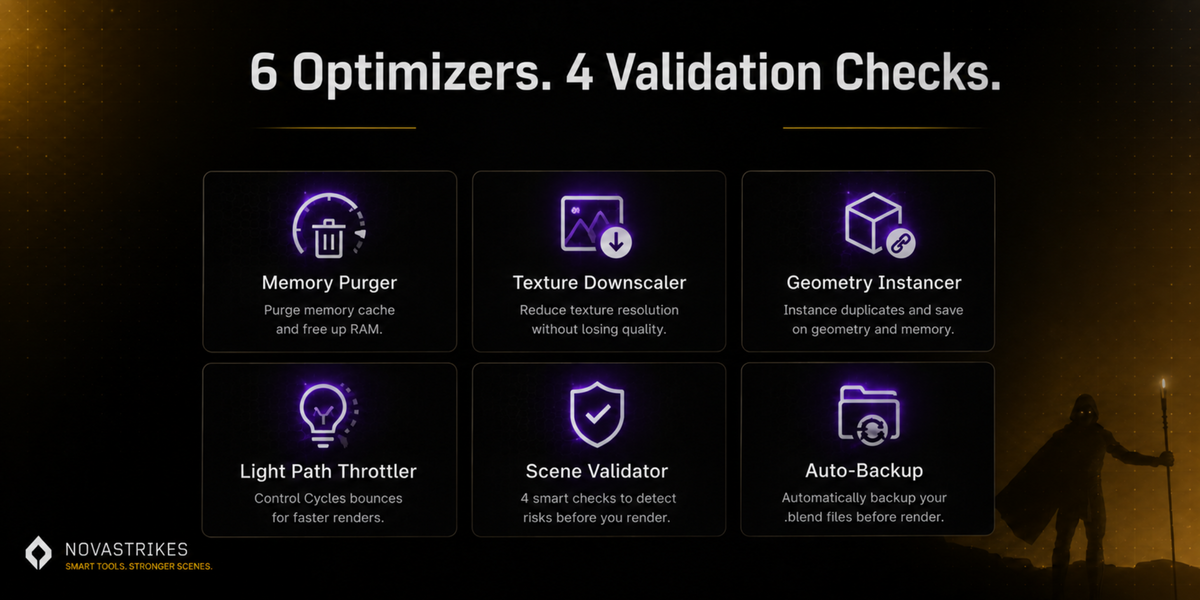
Before you render, click SCAN SCENE. This runs the Scene Validator, which checks for:
- Broken drivers
- Missing linked libraries
- Missing textures
- High-risk modifier setups
The Diagnostics panel also shows your GPU name, VRAM, and system RAM usage alongside triangle count, texture memory, and particle count — so you can see what's actually loading the scene before you commit to a render.
A clean scan returns SAFE — No issues found. If something's flagged, the panel tells you what and where, so you can fix it before committing render time — not after.
4. The optimizers, explained
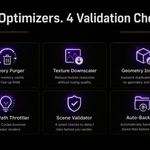
Each one runs independently — you don't have to use all of them. Purge Memory Cache is available in Lite; the rest are Pro (see section 7).
🧹 Purge Memory Cache
Clears orphaned data blocks — materials, meshes, images no longer used by anything in your scene, but still sitting in the file. Safe, non-destructive to anything actually in use. Available in Lite and Pro.
🔗 Instance Duplicates
Finds objects with duplicate geometry and converts them to linked instances, cutting memory usage. This changes object data relationships in your scene — a backup is made automatically first.
🖼️ Downscale Textures
Resizes textures larger than your chosen Target Size down to that resolution. This is destructive to the texture resolution in the working file — a backup is made automatically first, and it's worth checking that backup before you trust the result on a scene you care about.
Target Size is a dropdown — pick from 128, 256, 512, 1024, 2048, or 4096px. As a rough guide: 128–256px is plenty for background props the camera never gets close to, while hero assets in frame usually want 1024px or higher.
💡 Throttle Cycles Bounces
Trims excessive light bounce settings in Cycles that add render time with no visible difference. Cycles-only. On an EEVEE scene, this will report nothing to optimize — that's expected, not an error.
5. Locating & relinking missing textures
Pro only.
If Scan Scene flags a missing texture, click Locate Missing Textures. It searches your .blend file's own folder and subfolders for a file with the exact same filename as the missing one.
- A match found nearby is shown as a clickable path — nothing relinks until you click it
- If the same filename turns up in more than one subfolder, every match is listed — you choose which one, it's never picked for you
- No match nearby just shows "No match found nearby" — that's informational, not an error
This only searches near the .blend file itself, by exact filename — it won't search external drives or fuzzy-match similar names. If it can't find a match, you'll need to relink that texture manually through Blender's Image Editor.
6. Pro-only tools
🎭 Simplify / Restore Material Shaders
Replaces expensive procedural shader setups with flat equivalents to speed up viewport and render performance, and restores them back to the original when you're done. Useful on scenes with heavy node-based materials that are slowing down preview renders.
📋 Generate Forensic Log
Writes a full crash-forensic report — GPU/RAM diagnostics, heaviest mesh objects by triangle count, and pre-render validation results — to a text file next to your .blend. Genuinely useful after an unexplained crash: open the log and it tells you what was heaviest in the scene at the time.
⚡ Automatic Pre-Render Validation
Runs the Scene Validator automatically every time you hit render — no manual Scan Scene click needed first.
7. Safe Render & settings
SAFE RENDER runs your configured checks and optimizations, then starts the render — one button instead of doing each step manually. The settings that control it:
- Auto-Scan Before Render — runs the validator automatically each time you render
- Auto-Purge on Render — clears orphaned data-blocks automatically before each render
- Target Size — the resolution the downscaler resizes to (dropdown, default 2048px)
- Create Auto-Backup File — makes a scene backup before optimizers run. Leave this on.
8. Lite vs. Pro — what's actually different
Lite is free and open source: Purge Memory Cache, and the full Scene Validator + Diagnostics panel from section 3. That's genuinely all of it — nothing in Lite is a locked teaser for Pro.
Pro adds everything else: Auto-Backup, Downscale Textures, Instance Duplicates, Throttle Cycles Bounces, Locate/Relink Missing Textures, Shader Simplifier & Restorer, Forensic Logger, and Automatic Pre-Render Validation.
There used to be a middle Basic tier during the beta. It's gone — everything that was Basic-exclusive is now just part of Pro, alongside what used to be Pro-exclusive. One free tier, one paid tier, no in-between to figure out.
9. Precautions before you run it
Texture downscaling and duplicate-geometry instancing permanently change your working file. A backup is created automatically before either runs, but you should know where that backup lands and glance at it before you trust the result on anything important.
Recommended order: save through your normal version control first → click Scan Scene → review what's flagged → run individual optimizers rather than everything at once on a file you haven't backed up yourself.
This addon assists your judgment, it doesn't replace it. Keep your own backups and version control regardless of what runs automatically.
10. Troubleshooting
The Light Path Throttler says there's nothing to optimize.
Expected on EEVEE scenes — that optimizer only affects Cycles bounce settings. Not a bug.
A feature is greyed out and says "Pro Only."
That's a Pro-tier feature not included in Lite. See section 8 for the full breakdown.
VRAM Usage shows 0% even though I'm rendering.
On some GPUs (most non-NVIDIA cards), Windows and macOS don't expose a way to read live VRAM usage — only total capacity. When that's the case, the panel shows a note under the VRAM bar saying live usage isn't available for that GPU. The total VRAM number is still accurate; only the live usage percentage is affected.
The addon doesn't appear after installing.
Make sure you installed the zip itself (not an unzipped folder), and that the checkbox next to it is enabled in Preferences → Add-ons. Restarting Blender after install can also help.
Full step-by-step instructions with screenshots:
📄 Download the Smart Render Guard Instructions PDF →NovaStrikes · novastrikes.com
-
$16.99 $19.99
Every optimizer, the forensic crash logger, shader simplifier, and automatic pre-render validation — the full toolset, one license.
Have questions about this product?
Login to message