 TobiMade



Installation Instructions
Requirements
- Blender 4.2 or newer (tested through Blender 5.0)
Installing the Add-on
1. Download the `.zip` file from your Superhive purchase
2. Open Blender
3. Go to Edit > Preferences > Get Extensions
4. Click the dropdown arrow (top-right) and select Install from Disk...
5. Navigate to the downloaded `.zip` file and select it
6. The add-on installs and activates automatically
Finding the Add-on
After installation, the profiler lives in the 3D Viewport sidebar:
1. Open a 3D Viewport
2. Press N to open the sidebar (if not already visible)
3. Click the Profiler tab
You're ready to analyze your first scene.
Usage Documentation
Analyzing a Scene
1. Open the Profiler tab in the 3D Viewport sidebar
2. Click Analyze Scene to profile every object in your scene
3. To analyze only selected objects, check Selection Only before clicking Analyze
Analysis typically completes in under 100ms for scenes with hundreds of objects. Results update the summary, rankings, detail panel, and heatmap.
A small "Results outdated" warning appears when you modify the scene after analysis — just re-analyze to refresh.
Reading Results
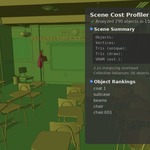
Scene Summary shows totals: object count, vertex/triangle counts, estimated VRAM, and budget violation count (if budgets are enabled).
Object Rankings lists every analyzed object sorted by cost score. Use the dropdown to sort by:
- Combined score (default)
- Geometry, Shader, Modifier, or Texture score
- Triangle count or VRAM
The filter slider hides objects below a minimum score so you can focus on the expensive ones.
Severity icons indicate cost level:
- Checkmark = Low (score below 0.25)
- Info = Medium (0.25 - 0.50)
- Warning = High (0.50 - 0.75)
- Critical = Critical (0.75+)
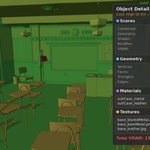
Object Detail expands the selected object's full breakdown:
- Geometry: vertices, edges, faces, triangles
- Materials: name, node count, complexity score
- Modifiers: name, type, cost score, high-cost flag
- Textures: image name, resolution, VRAM in MB
Using the Heatmap
1. Make sure your viewport is in Solid shading mode
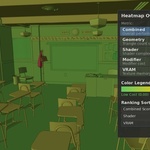
2. Open the Heatmap Overlay panel
3. Choose a metric (Combined, Geometry, Shader, Modifier, or VRAM)
4. Click Enable Heatmap
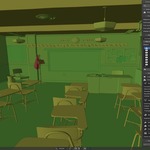
Objects are colored on a gradient from green (low cost) to red (high cost). Adjust the min/max range sliders to fine-tune the visualization.
Click Disable Heatmap to restore original object colors.
Performance Budgets & Presets
1. Open the Performance Budget panel and enable it with the checkbox
2. Choose a preset:
- Mobile VR: 10K tris/object, 64 MB VRAM, 0.3 shader complexity
- Desktop Game: 100K tris/object, 512 MB VRAM, 0.7 shader complexity
- High-End / Film: 500K tris/object, 2048 MB VRAM, 1.0 shader complexity
3. Or set custom values for each limit
4. Re-analyze the scene — objects exceeding any limit are flagged in the rankings and summary
Optimization Tools
Open the Optimization panel to access these tools:
- Decimate Selected — Adds a non-destructive Decimate modifier to selected meshes. Set the target face ratio (e.g., 0.5 = keep 50% of faces). Remove it anytime with the X button.
- Reduce Subdivision — Caps SUBSURF and MULTIRES viewport levels to a target (default: 1). Non-destructive.
- Merge Duplicate Vertices — Removes overlapping vertices within a distance threshold. Makes single-user copies of shared mesh data to avoid affecting other objects.
- Merge Identical Materials — Finds materials with matching node graph structures across the entire scene and consolidates them into one.
- Apply Modifiers — Bakes high-cost modifiers (Subsurf, Boolean, Remesh, etc.) into geometry. Choose to apply all high-cost types, or just Boolean/Remesh specifically.
- Optimize to Budget — Automatically decimates every object that exceeds your performance budget, calculating the ratio needed to bring each object under the triangle limit.
Exporting Reports
1. Analyze your scene first
2. Open the Export panel
3. Click Export JSON Report for a detailed machine-readable report, or Export CSV Report for spreadsheet-compatible output
4. Choose a save location in the file browser
Reports include all scores, geometry stats, material/modifier/texture details, and budget violation flags. Both formats sort objects by cost (highest first).
Custom Scoring Weights
Open the **Scoring Weights** panel and enable custom weights. Adjust sliders to control how much each category contributes to the combined score:
- Geometry (default 0.30) — vertex/triangle complexity
- Shader (default 0.25) — material node graph complexity
- Modifier (default 0.20) — modifier stack overhead
- Texture (default 0.25) — VRAM from image textures
Weights are normalized automatically. Disable custom weights to use the global defaults from addon preferences.
FAQ
What object types are analyzed?
Meshes, Curves, Surfaces, Metaballs, and Text objects. Lights, cameras, empties, and armatures are skipped since they have negligible rendering cost.
Is optimization destructive?
It depends on the tool. **Decimate** and **Reduce Subdivision** are non-destructive — they add or adjust modifiers that you can remove or tweak. **Merge Vertices**, **Merge Materials**, **Apply Modifiers**, and **Optimize to Budget** make permanent changes to your data. Always save your file before running destructive operations, or use Blender's Undo (Ctrl+Z) to revert.
How does scoring work?
Each object gets four sub-scores (geometry, shader, modifier, texture) normalized to a 0–1 range based on the scene's overall distribution. These are combined into a weighted average. A score of 0.0 means negligible cost; 1.0 means the most expensive object in the scene. Scores are relative — they tell you which objects are expensive compared to others in the same scene.
Does it work with Blender 5.0?
Yes. Scene Cost Profiler is tested with Blender 4.2 LTS through Blender 5.0. It handles the Blender 5.0 extension system and API changes automatically.
Can I undo optimization?
Yes. Blender's standard Undo (Ctrl+Z) works for all optimization operations. Non-destructive tools (Decimate, Reduce Subdivision) can also be removed manually from the modifier stack at any time.
Does it support instanced objects?
Yes. The profiler detects instanced (linked) mesh data and reports both unique triangle counts and total draw-call triangle counts in the scene summary. Instanced objects are tagged in the detail panel.
How accurate is the VRAM estimate?
VRAM estimation is based on texture resolution, bit depth, and a configurable mipmap factor (default 1.33x). It covers image textures assigned through material nodes. It does not account for GPU-side mesh buffers or render engine overhead, so treat it as a practical approximation.
Have questions about this product?
Login to message
| Blender Extension Compatible | Yes |
| Published | 7 months ago |
| Blender Version | 4.2 - 5.0 |
| Extension Type | Add-on |
| Render Engine Used | Arnold, Blender-Internal, Blender-Game-Engine, Cycles, Eevee, Freestyle, Luxrender, Mental-Ray, Octane, Vray, Yafaray |
| License | GPL |
