Shader-Nodes Doctor 2.0 - See, Debug, and Optimize Your Shader Nodes Instantly
 peterz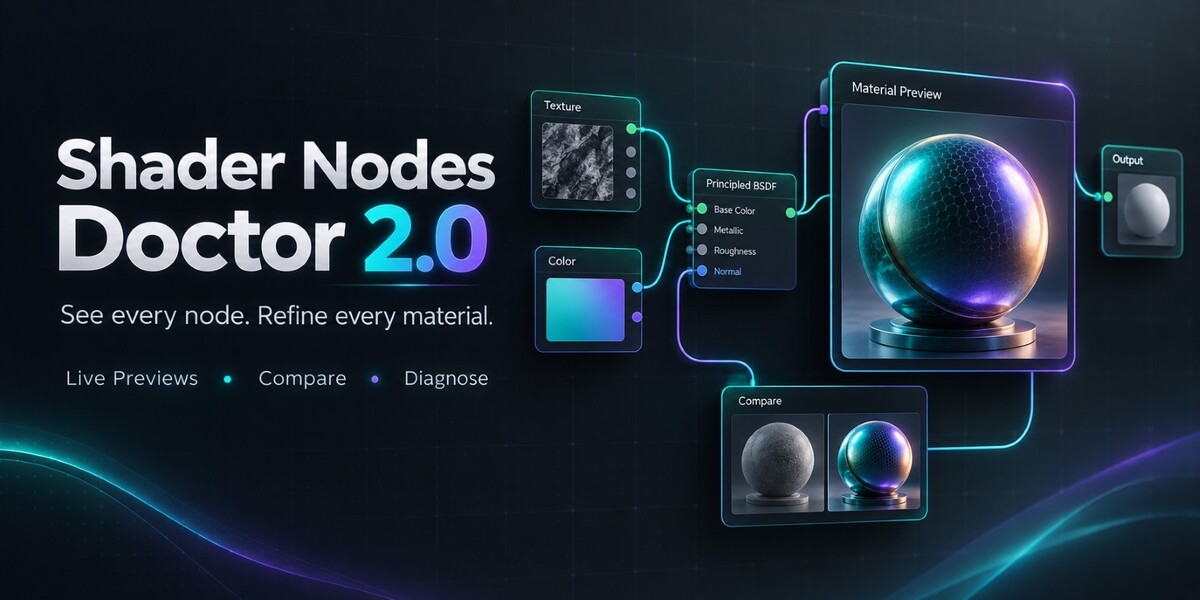







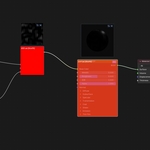
Shader Nodes Doctor 2.0
User Documentation
Shader Nodes Doctor helps you preview node outputs, inspect material channels, diagnose shader problems, and navigate complex graphs inside Blender’s Shader Editor.
Version 2.0 introduces automatic Selected + Pinned previews, interactive preview cards, output selection, Before / Current comparisons, background rendering, and targeted diagnostic actions.
1. Requirements and Installation
Requirements
Shader Nodes Doctor requires Blender 4.2 or newer.
Version 2.0 has been tested on Windows with Blender 4.2.16, 4.5.11, and 5.2.0. The package also declares support for Linux x64, macOS Apple Silicon, and macOS x64. These platforms were not included in the local release tests.
Installation
- Open Edit > Preferences.
- Go to Get Extensions and choose Install from Disk from its menu.
- Select the Shader Nodes Doctor ZIP file.
- Complete the installation and ensure the add-on is enabled.
For a legacy add-on installation, use Preferences > Add-ons > Install from Disk, where available. Menu placement may vary between Blender versions.
Opening Shader Nodes Doctor
Select an object with a material and open its Shader Editor. Press N to display the sidebar, then select the Shader Doctor tab.
2. Quick Start
- Open a material’s node graph.
- Expand the Preview panel and enable Enable Previews.
- Leave Selected + Pinned turned on.
- Select a node with a previewable output.
- Start with the Fast quality preset and wait for the preview card.
- Click P on the card to keep it visible while selecting other nodes.
- Change a node parameter. With Auto Refresh enabled, the preview updates after the graph changes.
If a card does not appear, use Preview Selected Node or the node’s PV button. Some nodes do not expose a previewable output.
Floating cards inspect node results while keeping the material’s normal Material Output connections in place. Solo Preview and Channel Preview temporarily change those connections for viewport inspection.
3. Preview Cards
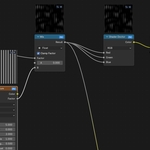
Selected + Pinned Mode
Selected + Pinned displays selected nodes and nodes you have pinned.
Pinning keeps a card visible after deselection. Its image continues to update as you edit the material.
Turn this mode off to use manually enabled previews.
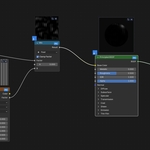
Card Controls
- P: Pin or unpin the preview.
- v: Choose an output when multiple outputs are available.
- X: Hide the card.
- PV on the node: Toggle its preview.
- Bottom refresh button: Update that card alone.
- Drag the title: Move the card.
- Drag a corner of the active card: Resize the card.
- Esc or right-click during a drag: Cancel the change.
- Right-click a card: Open refresh, comparison, and layout actions.
Hover over a control to see its description.
Size and Placement
Use the size button beside Preview Selected Node to cycle through Normal, Large, and XL.
Settings also provides Card Size, Card Scale, Anchor, and Reset Card Layout for the active node.
Cards automatically avoid nearby nodes, other cards, and the sidebar where space allows. Crowded graphs may require manual placement.
Max Visible Cards controls how many cards appear in one editor. Enable Show Card Info in Settings to display an additional preview summary.
Use the node’s PV button or Reset Card Layout to show a hidden card again.
Pixel Inspection
Click a preview image to inspect a pixel. The readout shows:
- Pixel coordinates
- Linear RGBA values
- A raw-channel hexadecimal value
Click outside the card to dismiss the readout.
The hexadecimal value is calculated from the image channels. It may differ from the visible screen color after Blender’s display transform.
4. Outputs and Comparisons
Choosing an Output
For nodes with several outputs, choose a socket from the card’s v menu or from Preview > Output and Compare > Output.
Auto uses the add-on’s automatic output selection. Choosing a named socket targets that output.
The Channel setting provides these display modes:
- Auto
- Shader
- Color
- Value
- Vector
- Alpha
- Normal
- Displacement
Start with Auto and select another mode when you need a particular interpretation of the output. Some non-color data is encoded or approximated for display.
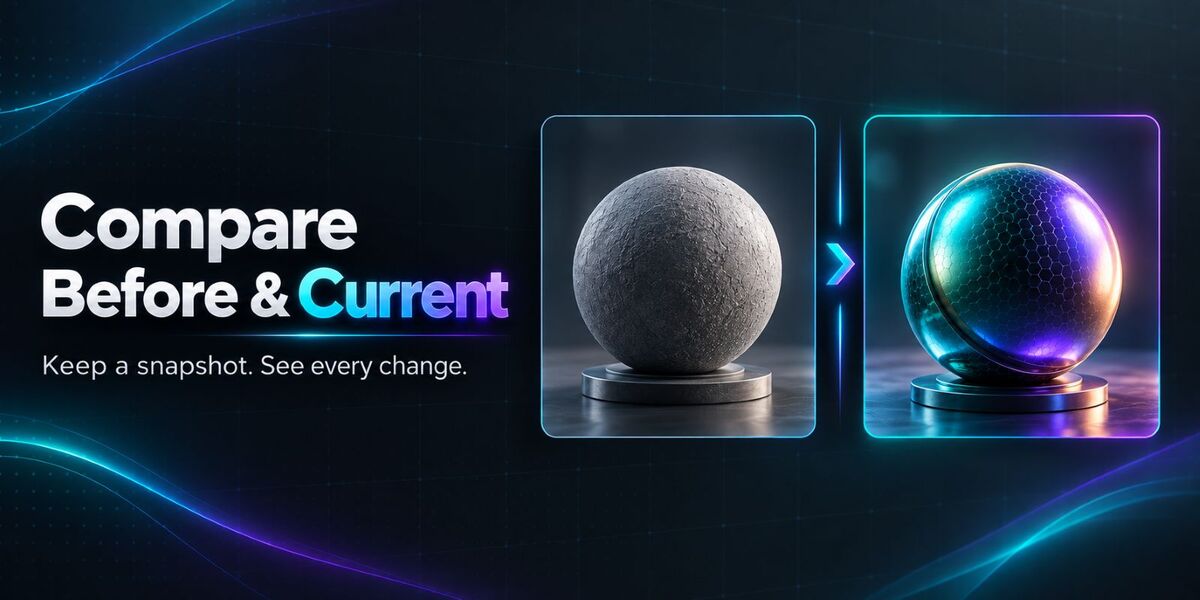
Before / Current Comparison
Use comparison mode to inspect the visual effect of a material edit.
- Wait until the preview shows Ready.
- Right-click its card and choose Remember Current Result, or click Remember Result in Output and Compare.
- Change the node parameters.
- Enable Compare Before / Current in the card menu, or Compare in Output and Compare.
- Use Clear Comparison to remove the saved image for that output.
Before retains the remembered image. Current follows subsequent preview updates.
Snapshot Behavior
Snapshots are tracked separately by material, group path, node, and output. Up to eight snapshots are retained.
Snapshots contain images and summaries. They do not store earlier node parameters or provide material rollback.
Loading a file, undoing, or disabling the add-on clears comparison snapshots. Clear Render Cache keeps remembered comparisons.
An initial approximate EEVEE preview cannot be used as a comparison baseline. Wait for the completed result before remembering it.
5. Preview Quality and Rendering
Quality Presets
- Fast: 64-pixel preview with Low quality.
- Balanced: 128-pixel preview with Medium quality.
- Detailed: 256-pixel preview with High quality.
Use Fast while exploring a graph, then increase quality when inspecting a particular result.
Resolution and Preview Quality can also be adjusted separately in Settings.
Preview Model
Preview Model offers Auto, Sphere, and Plane.
Auto uses a sphere for Shader outputs and a plane for other results.
Render Engine
The preview renderer follows the scene engine:
- Cycles scenes use Cycles.
- Other scene engines use EEVEE for material previews.
Material previews render through a reusable local Blender background process. Simple supported outputs can use a direct calculation path.
The first EEVEE preview may take longer while rendering initializes. Compatible materials can display an approximate image during preparation. That image is automatically replaced by the completed EEVEE result.
Later preview tasks reuse the background process where possible.
Preview Status
Ready
The current preview has completed.
Updating
A new result is being prepared.
Updating · previous result
An older image remains visible while the new result is generated.
Approximate · preparing EEVEE
A temporary approximation is displayed during EEVEE startup.
Previous result with an error
The update failed. The retained image may no longer match the current graph.
Refresh Controls
Auto Refresh updates previews after graph changes. Turn it off while making extensive edits and refresh manually when ready.
Refresh Now requests updates for visible previews. A card’s refresh button updates that preview alone.
6. Advanced Preview Settings
Open Settings and enable Advanced to access scene synchronization and filtering options.
- Selected Objects Only: Filter preview work by object selection.
- Selected Material Only: Filter preview work by material context.
- Sync World: Follow the source scene’s World settings.
- Sync Lighting: Include supported scene lights.
- Max Synced Lights: Control how many lights are included.
- Sync Color Management: Follow the source scene’s color settings.
- Suspend Scene Preview: Temporarily change Material or Rendered 3D Viewports to Solid to reduce competing GPU work.
Turning Suspend Scene Preview off restores the viewports’ previous shading modes.
Previews use a temporary scene, a small model, and limited rendering quality. Scene synchronization can improve the match, but previews may still differ from a final production render.
7. Preview Node and Viewport Inspection
Dedicated Preview Node
Add a Preview Node through:
Add > Shader Doctor Preview Node
or:
Settings > Add Preview Node
This wrapper provides pass-through sockets for Shader, Color, Value, Vector, Alpha, Normal, and Displacement.
Connect the upstream data you want to inspect to the appropriate socket.
Floating previews also work inside nested shader groups when their path can be resolved from the material root.
Solo Viewport Preview
In the root material graph, use Ctrl + Shift + Left Mouse on a node to temporarily route its output to Material Output.
To restore the original connections:
- Repeat the shortcut on the same node.
- Click Exit Preview.
- Use Node > Shader Doctor > Restore Material Output.
The solo shortcut works in the root material tree. Use floating cards to inspect nodes inside nested groups.
Material Channel Preview
- Open Preview > Channel Preview.
- Choose an available channel: Base Color, Roughness, Metallic, Normal, or AO.
- Click Preview Channel.
- Click Exit Preview when finished.
The Preview Selected Node action in this panel temporarily routes the selected node for viewport inspection.
A channel is available only when the analyzer detects a suitable source.
8. Material Analysis and Repair
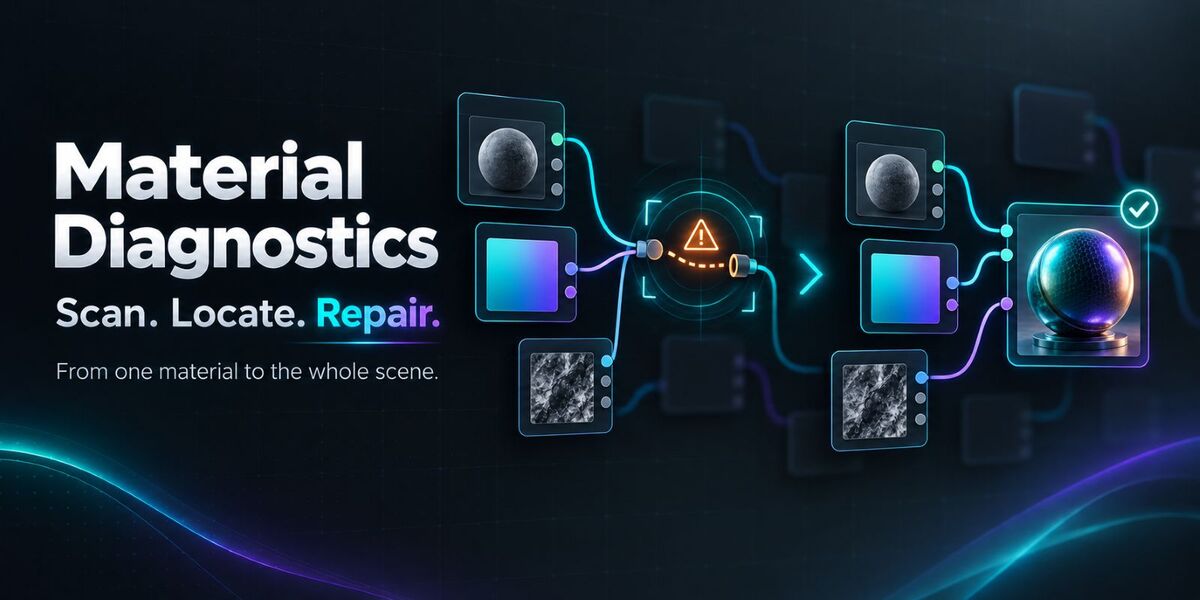
Analyze a Material
Open Check Material and click Analyze.
Review the simplified Surface chain, detected channels, and reported issues.
The analysis controls include:
- Inspect: Enter a contributing group in the analysis context.
- Root: Return to the material root.
- Parent: Move up one analysis level.
- Strict Principled: Apply diagnostic expectations for a Principled PBR workflow.
Materials using a different shader design may be intentional.
Locate and Fix Individual Issues
Locate selects the node associated with an issue, including its group path when that path can be resolved.
Fix This applies one currently applicable repair. The issue is checked again before the action runs.
Repair Tools
Under Check Material > Repair:
Run Safe Fixes applies supported repairs to the current material.
Reconnect PBR attempts high-confidence texture connections to a Principled shader.
Review the graph and rendered result after a repair. Image color-space changes affect the image datablock, including other nodes and materials that share it.
Graph edits can be reversed with Blender Undo.
Removing Unlinked Nodes
Delete Unlinked Nodes is a separate Settings action.
It removes disconnected nodes, including disconnected alternatives you may have kept for later use.
9. Batch Material Checks
- Open Batch.
- Choose Scene or Active Collection as the Scan Scope.
- Click Scan Materials and review the results.
- Choose a Result Filter.
- Select fixable entries individually or use Select Visible.
- Click the Apply Filtered Fixes button and confirm the operation.
The apply button displays the number of selected results.
Only selected results visible under the current filter are included.
Deselect All clears selections. Clear Results clears the scan list.
10. Graph Navigation and Analysis
Graph Navigator
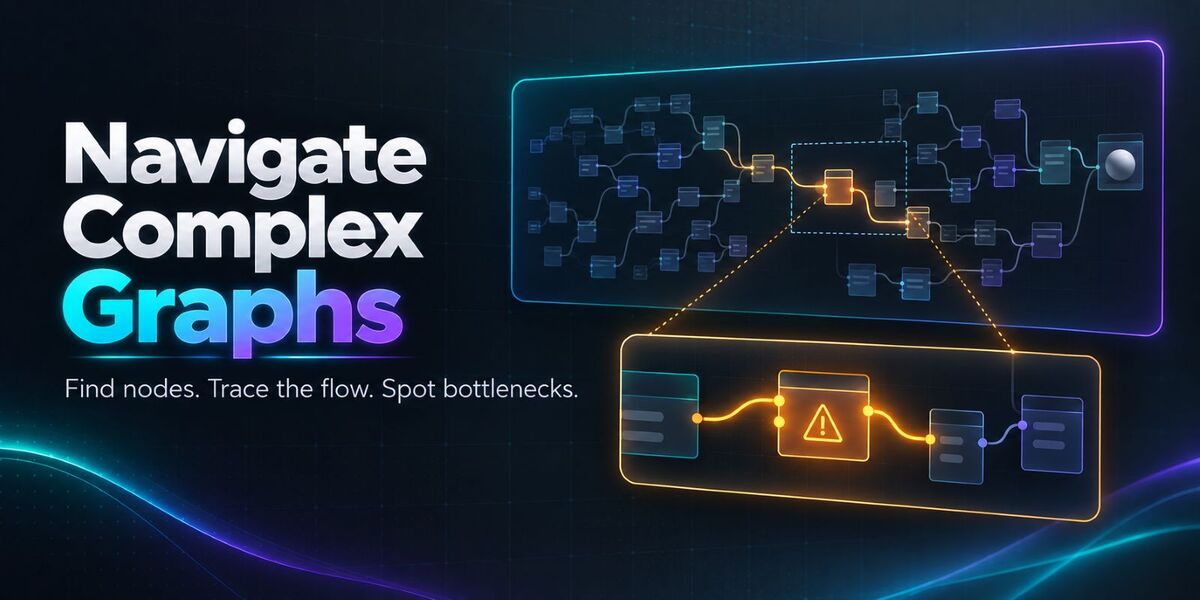
Graph Navigator provides:
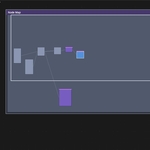
- A minimap
- Node counts
- Focus Active
- Fit All
- Group navigation
- Node search
- A node-type summary
Use these tools to locate nodes and move through large material graphs.
Execution Order
Click Analyze Order to build a step list.
Use Prev, Next, Play Through, and Show Full Order to trace the analyzed graph.
Clear Analysis removes the display.
Slow Nodes
Click Estimate Slow Nodes to compare graph-update behavior while nodes are temporarily muted.
Click a result to locate its node, or enable Show Heatmap.
Repeated measurements help distinguish a meaningful signal from measurement variation.
Slow Nodes measures graph-update behavior, rather than per-node GPU render time. Use its results to guide further investigation.
11. Add-on Preferences
Auto Refresh
Enable automatic preview updates.
Refresh Interval
Set the minimum time between automatic refresh passes.
Max Visible Cards
Set the number of cards displayed in one editor.
Keep Preview Files
Retain temporary preview files for debugging. This option is disabled by default.
12. Troubleshooting
No Preview Card Appears
Check Enable Previews, the material context, node selection, the PV button, and Max Visible Cards.
Confirm that the node has a previewable output, then try Refresh Now.
The Wrong Output Is Displayed
Choose the desired socket from the card’s output menu. Start with Channel set to Auto.
The Preview Looks Stale
Refresh the card. If needed, use Settings > Clear Render Cache.
The Preview Takes Too Long
Use Fast, reduce visible cards or synced lights, and disable Auto Refresh during extensive edits.
Allow time for the first EEVEE initialization.
The Viewport Still Shows an Isolated Node
Click Exit Preview or use Restore Material Output.
Remember Result Is Unavailable
Wait for a current completed preview. Approximate, outdated, or failed results cannot be remembered.
The Preview Differs from the Final Render
Check the scene engine, World, lighting, color management, quality, and preview model.
Texture Edits Are Missing
Save external image edits to disk or pack the image before previewing.
13. Workflow Limits
Floating previews depend on the material context and resolvable group paths.
Shaders that rely heavily on other scene objects may behave differently in the temporary preview scene. Large resources can also add time to snapshot export and image import.
Preview-image statistics describe rendered pixels. Direct RGB and Value constants can display their source values; other summaries should not be treated as exact socket values or final-render measurements.
Comparison snapshots remain within the current session and should be used for visual inspection rather than material backup.
Have questions about this product?
Login to message
| Blender Extension Compatible | Yes |
| Published | 5 months ago |
| Blender Version | 4.2 - 5.2 |
| Extension Type | Add-on |
| Render Engine Used | Cycles, Eevee |
| License | GPL |
Discover more products like this
blender plugins shader nodes winter24 Material preview addon real-time node preview summer24 Shader