Modifier Profiler — Which Modifier Is Eating Your Viewport
 Skava
Skava

Modifier Profiler — Documentation (v1.2.0)
Times the modifier stacks of the selected objects and names what costs the most. Everything it switches while measuring is put back.
1. Install
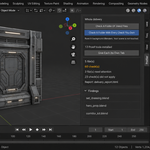
Download the zip and leave it zipped. In Blender open Edit, then Preferences, then Add-ons. Use the arrow button in the top right corner of that window and choose Install from Disk, then pick the zip. On Blender 4.0 and 4.1 the same button is called Install. Tick the checkbox next to the add-on name. Press N in the 3D Viewport and the Profiler tab appears in the sidebar.
2. Quick start
- Select the objects you care about, or all of them.
- Press Measure Modifiers.
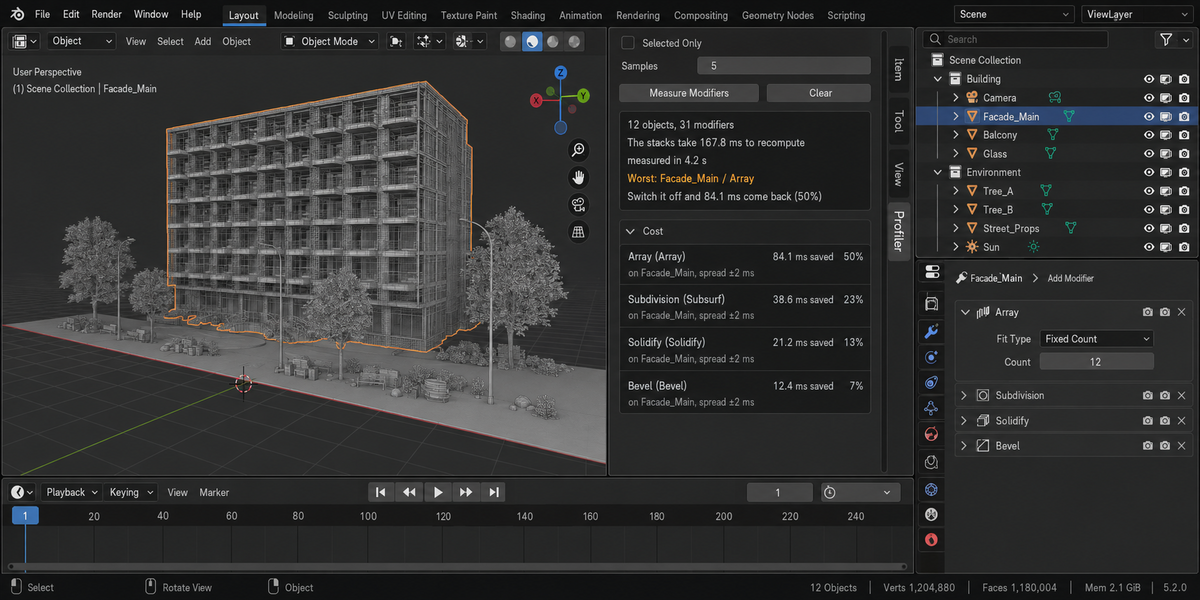
- Read the top line: how long the stacks take to recompute, and which single modifier costs the most.
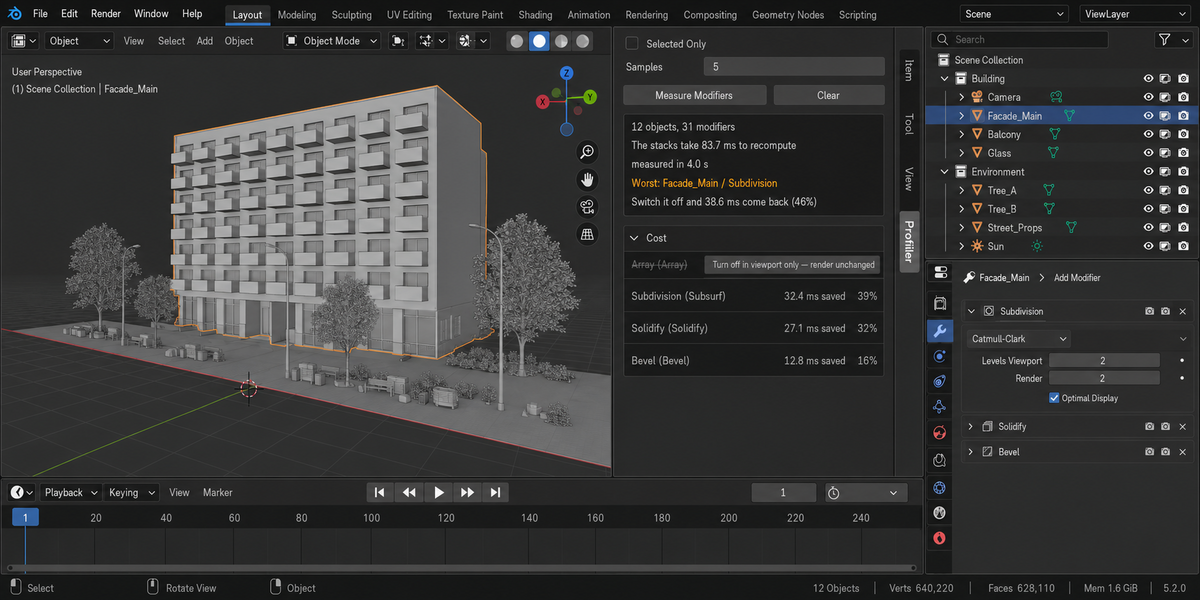
- Press the eye button on that row to switch it off in the viewport and measure again.
3. How it measures
For each object the whole stack is evaluated several times and the median is taken. Then one modifier is switched off for the viewport, the stack is evaluated again, and the difference is that modifier's cost. The stack is measured a second time at the end, after all the switching, and both samples are pooled — caches warm up and processor clocks drift while a run is going on.
4. Reading the table
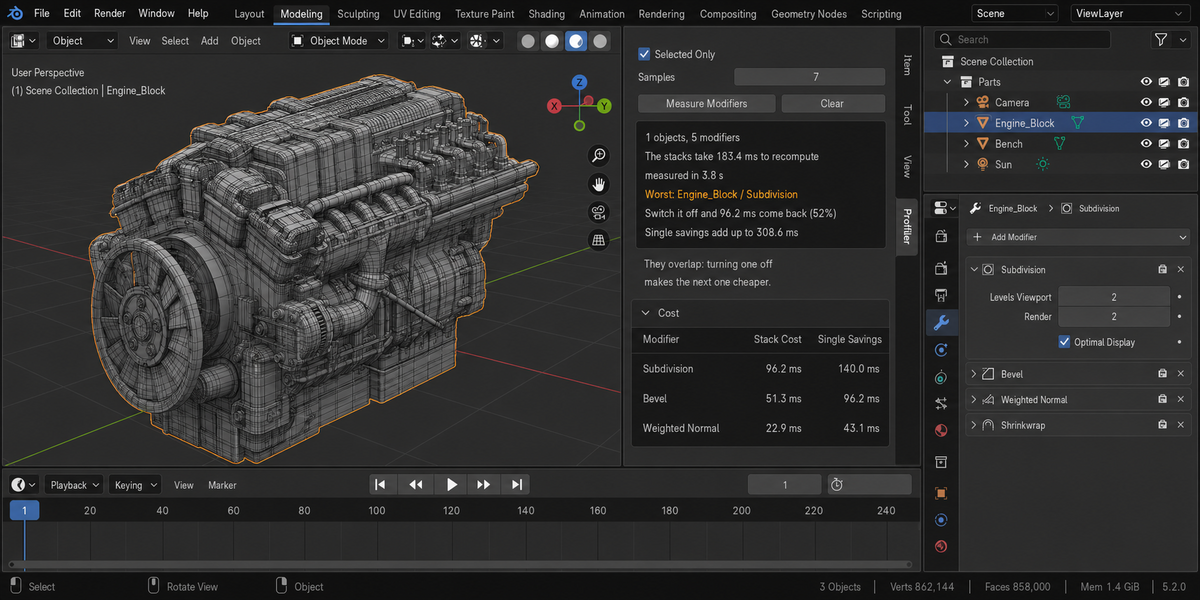
Each row shows the milliseconds that come back if you switch that modifier off, its share of the stack, its name and type, the object it sits on, and the spread of the samples. Two rows whose costs are within each other's spread really are that close — raise the sample count to separate them.
5. Why the shares add up to more than a hundred
Because they overlap. Switching one modifier off makes the next one cheaper, so the savings cannot be summed. The total on the top line is the stack time as measured, not the sum of the rows. The sum is shown separately, with that warning next to it.
6. Samples
The Samples field sets how many times each state is evaluated. Three is a good default. One is a glance, not a measurement.
7. Turning a modifier off
The button on a row flips that modifier's viewport flag and leaves its render flag alone, so your render is unaffected. Pressing it again puts it back.
8. Neighbour advice
Pairs of modifiers that make little sense in sequence are listed under the table — two subdivisions in a row, for example. This is advice only; nothing is changed.
9. What it never changes
Object data, modifier settings and modifier order are untouched. Viewport flags are restored to exactly what they were before the run.
10. Compatibility
Blender 4.2 and later. Tested live on 5.1 and 5.2.
11. License
GPL-3.0.
Checking a whole folder
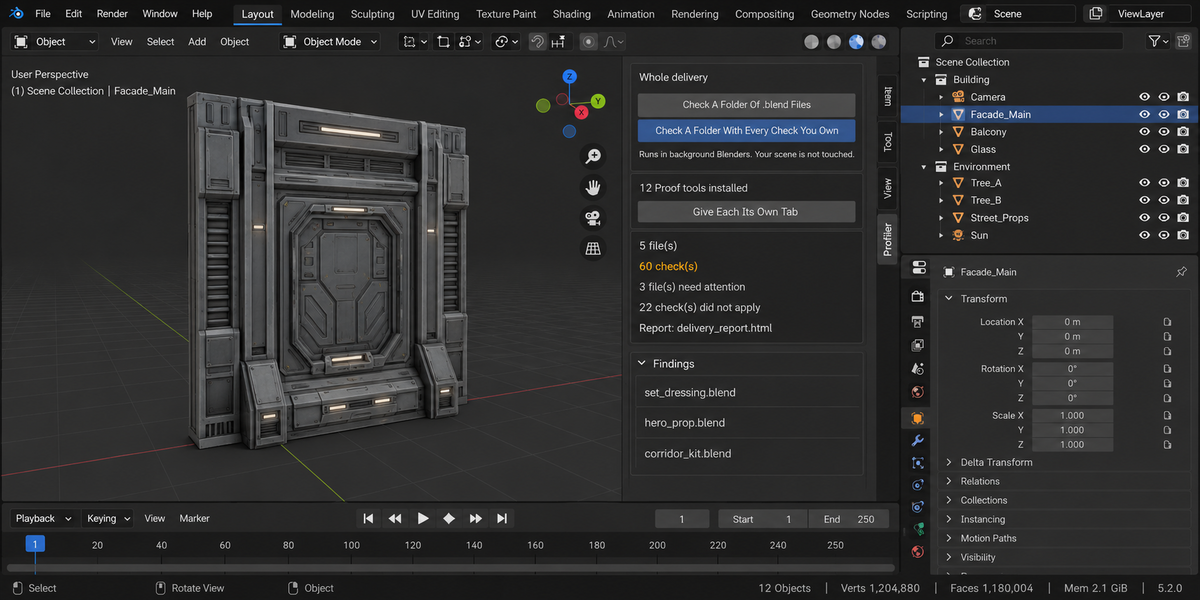
The sidebar has a Whole Delivery panel. It has two buttons.
Check A Folder Of .blend Files runs this product over every.blend in the folder you pick. Check A Folder With Every Check YouOwn runs every tool from this line that you have installed, over thesame files, in one pass — one report, one verdict.
Each file is opened in its own background Blender. Your open scene is nevertouched: not opened over, not saved, not modified in any way. This is also why afile that will not open costs you only that file — the rest of the delivery isstill checked. Press Escape to stop; nothing partial is written, because areport covering half a delivery is a report nobody should trust.
When it finishes you get an HTML report next to the folder. It is one filewith nothing loaded from the internet, so it can be attached to an email, put inthe delivery folder, or opened years later on a machine that has never seen thisadd-on.
Running it from a pipeline
The same check runs headless, with no interface and no person, and finisheswith a code your build system can read: one code for clean, another whensomething blocking was found, and a third when a file could not be checked atall. Those last two are deliberately different. A check that did not run has notpassed, and a gate that treats silence as success will one day wave through thedelivery it existed to stop. The exact command line is in the add-onpreferences.
Comparing against last week
Any run can be saved as a baseline. A later run then reports what changed:which numbers moved and in which direction, which findings are new, and whichones you have fixed since. Direction matters and is not guessed — eachmeasurement carries its own sense of which way is worse, so rising coveragereads as better and rising drift reads as worse.
Signing a file off
When a file is clean you can sign it off. The record lives inside the .blenditself, not in a folder next to it, so it travels with the file: open it nextmonth and it tells you when it was checked, by which version, and how it cameout. If the file is saved after that, the record says plainly that it is out ofdate — a sign-off that survives an edit it never saw would be worse than nosign-off at all.
One tab instead of twelve
Every tool in this line can put its panel under a single shared sidebar tabinstead of its own. One button does it for all of them at once, and each panelarrives collapsed, so twelve tools cost you one tab and no scrolling. Yourchoice is remembered, and a tool that you later use on its own can be given itsown tab back the same way.
What is deliberately not claimed
A check that could not run is reported as exactly that, never as a pass. If atool from this line is not installed, or is an older version that predates thecombined run, the report names it in a list of checks that did not take part,so the gap is visible rather than quietly absent.
Have questions about this product?
Login to message
| Published | 10 days ago |
| Blender Version | 4.2 - 5.2 |
| Extension Type | N/A |
| Render Engine Used | Cycles, Eevee |
| License | GPL |
Discover more products like this
optimization pipeline modifier Scene audit profiler viewport performance debug timing subdivision benchmark